Key takeaways
- Most AI visibility tools export raw data, but Looker Studio templates turn that data into stakeholder-ready dashboards in minutes rather than hours.
- The right template depends on your data source: native connectors (like Otterly.AI's) are fastest, while API-based tools (like Profound) offer more flexibility for custom BI pipelines.
- A good AI visibility dashboard tracks at least four things: citation frequency by model, brand mention share vs competitors, prompt-level performance, and traffic attribution.
- Tools like Promptwatch go further by combining visibility tracking with a built-in Looker Studio integration and API, so your dashboard data is always tied to real optimization actions.
- Free templates from Google's Report Gallery are a decent starting point, but purpose-built AI visibility templates save significantly more setup time.
If you've been tracking AI search visibility for more than a few weeks, you've probably hit the same wall: the data exists, but getting it into a format that means something to a client or an exec takes forever. You end up rebuilding the same charts every month, arguing with calculated fields, and spending more time on the report than on the actual insights.
Looker Studio templates solve this. A good template gives you the structure, the calculated fields, and the visual layout pre-built. You connect your data source, adjust the date range, and you're done. The question is which templates are actually worth using for AI search visibility specifically, because most of the popular ones were built for GA4 or Google Ads, not for tracking how often ChatGPT cites your brand.
This guide covers what to look for, which templates work best for different use cases, and how to connect your AI visibility data to Looker Studio without losing your mind.
Why Looker Studio for AI visibility reporting?
Looker Studio is free, shareable, and connects to a growing list of data sources via community connectors. For AI visibility reporting, that matters because your data might live in several places: an AI monitoring platform, Google Search Console, GA4, and maybe a custom API.
The other reason is client communication. A live Looker Studio dashboard is easier to share with a client than a CSV export or a screenshot. You can set up automated email delivery, embed it in a client portal, or just send a link. That's hard to replicate with most native reporting interfaces inside AI visibility tools.
The catch is that building a good dashboard from scratch takes time. A 2023 BARC report found that using pre-built templates cuts report development time by up to 50%. For AI visibility specifically, where the metrics are still relatively new and not everyone knows what they're looking at, a well-structured template also helps you tell the right story.
What a solid AI visibility dashboard should track
Before picking a template, it's worth being clear on what you actually need to measure. AI search visibility reporting is different from traditional SEO reporting, and the metrics don't map neatly onto what you'd put in a GA4 or Search Console dashboard.
The core metrics worth tracking:
- Citation frequency: How often does your brand or domain appear in AI-generated responses? Broken down by model (ChatGPT, Perplexity, Gemini, etc.) and by prompt category.
- Brand mention share: Your citations as a percentage of total citations across your competitive set. This is the AI equivalent of share of voice.
- Prompt-level performance: Which specific prompts or question types trigger your brand to appear? Which ones don't, but should?
- AI-driven traffic: Sessions and conversions that originated from AI search engines. This requires either a tracking snippet, GSC integration, or server log analysis.
- Competitor visibility: How your citation rate compares to competitors across each AI model.
- Content gap signals: Which prompts are competitors winning that you're not showing up for at all?
Not every tool exports all of these fields. When choosing a template, you need to match the template structure to what your data source actually provides.
Template sources worth knowing about
Google's Looker Studio Report Gallery
The official gallery is the obvious starting point. It's free, the templates are well-documented, and you can copy any report with a single click. The problem is that almost nothing in the gallery was built for AI visibility. You'll find solid GA4 dashboards, Search Console reports, and Google Ads templates, but nothing purpose-built for tracking LLM citations.
That said, the GA4 template is genuinely useful as a base layer. If you're building a combined dashboard that shows both traditional search traffic and AI-driven traffic, starting with the GA4 template and adding AI visibility panels on top is a reasonable approach.
Otterly.AI's native Looker Studio connector
Otterly.AI has a dedicated Looker Studio connector that pipes AI visibility data directly into a dashboard. They also provide a pre-built template you can copy, which includes fields for brand mention frequency, model-by-model breakdowns, and competitor comparisons.
The advantage here is speed: the connector handles the data pipeline, and the template handles the layout. You're not building anything from scratch. The limitation is that Otterly.AI is primarily a monitoring tool, so the template reflects that. You get good visibility data, but there's no built-in path from "I see a gap" to "here's the content I need to create."
Otterly.AI

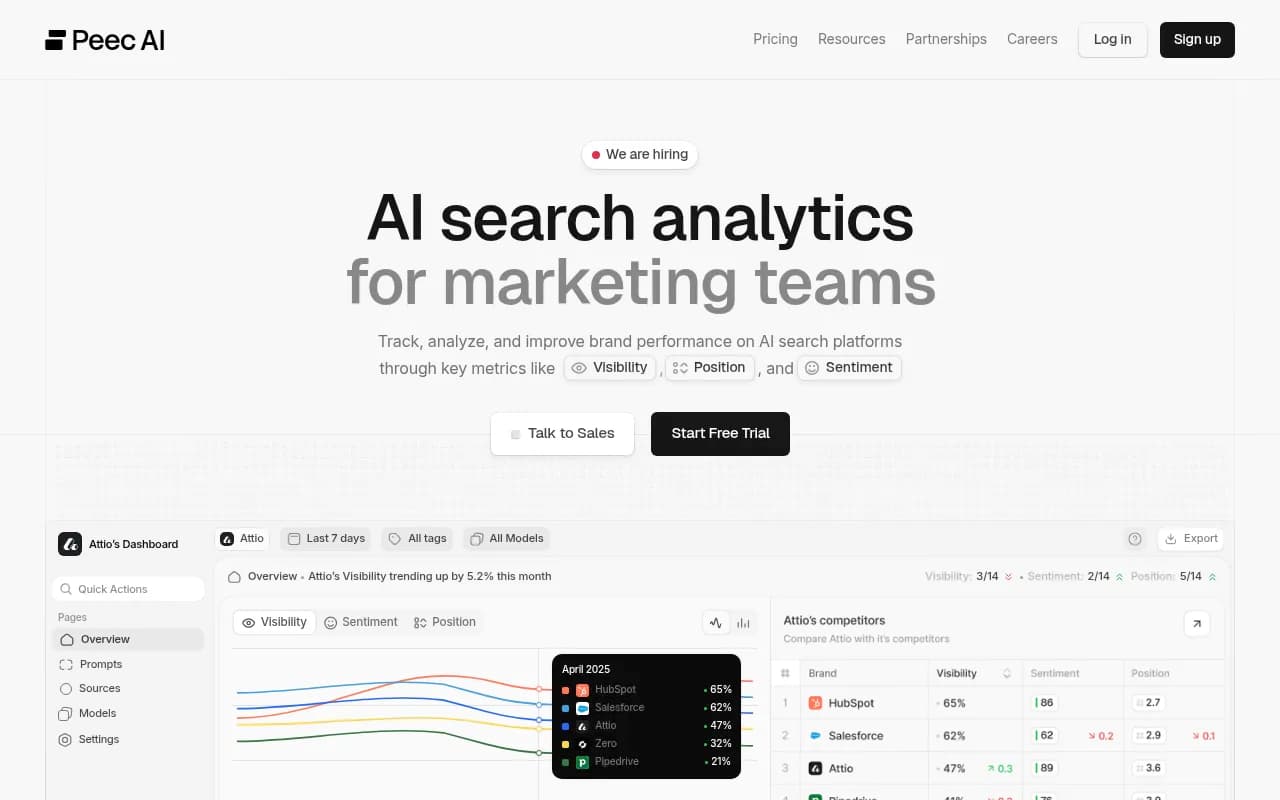
Peec AI's community connector
Peec AI offers a community connector for Looker Studio with documented field names, which makes it easier to build custom dashboards or adapt existing templates. The field documentation is genuinely useful if you want to build something beyond the default layout.
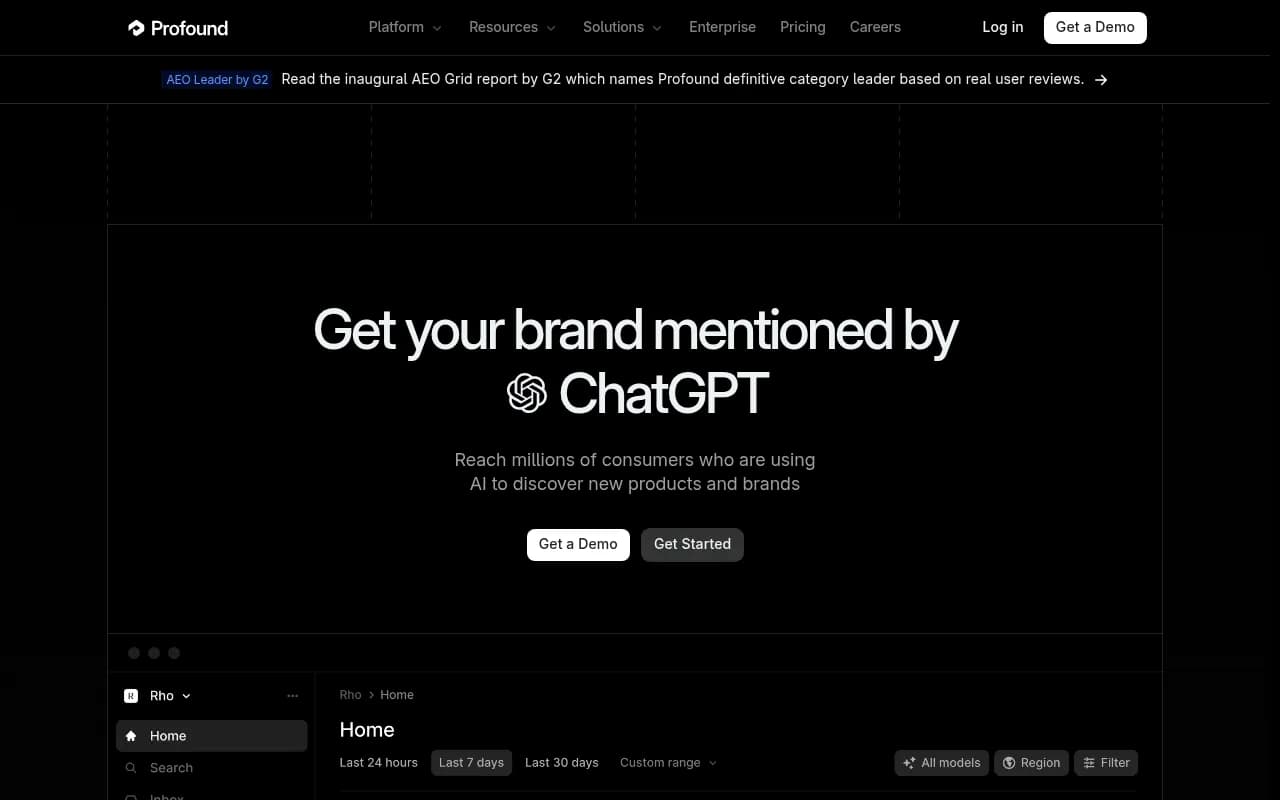
Profound's REST API
Profound takes a different approach: instead of a native connector, they offer a REST API with official SDKs. This is more work upfront, but it gives you the most flexibility. If you're building a custom BI pipeline or need to combine AI visibility data with other enterprise data sources, the API route is worth the setup time.
Profound
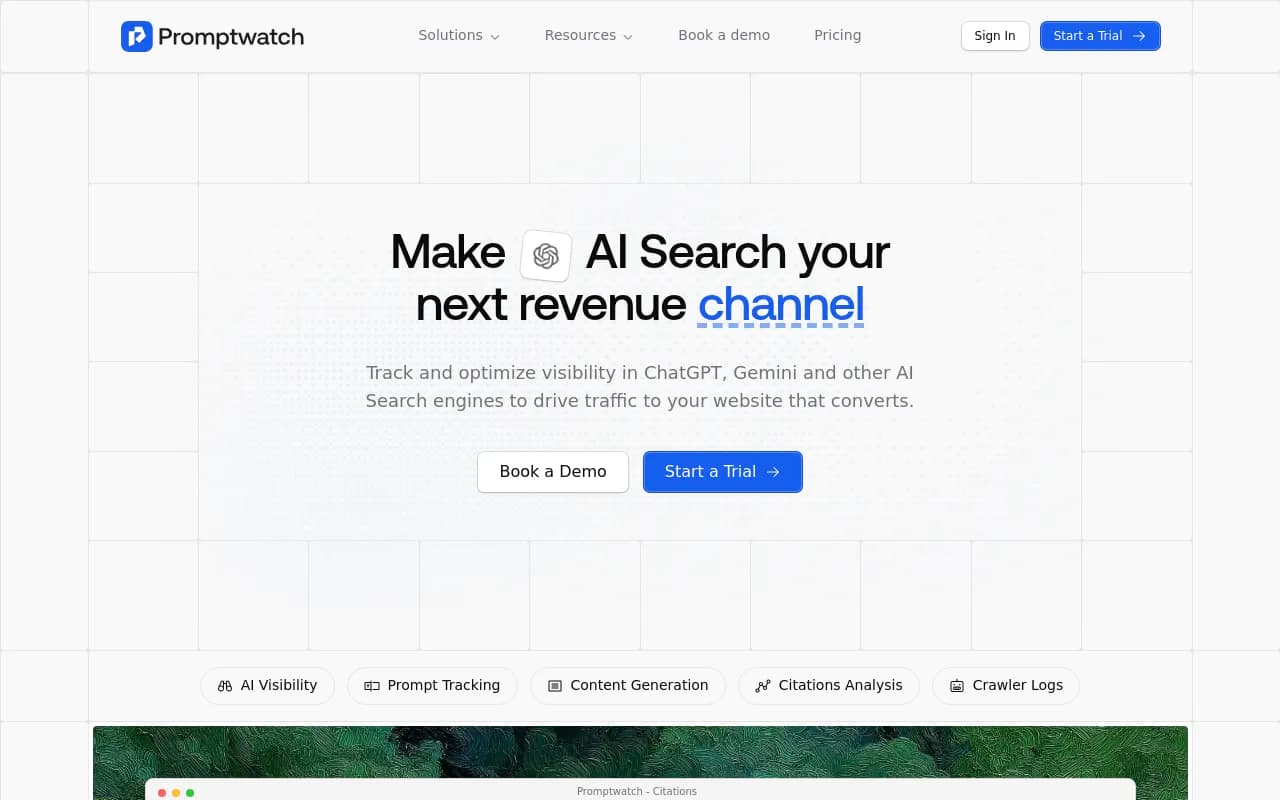
Promptwatch's Looker Studio integration and API
Promptwatch offers both a Looker Studio integration and an API, which means you can pull data into custom dashboards while also using the platform's native reporting. The difference from monitoring-only tools is that the underlying data includes prompt volumes, difficulty scores, query fan-outs, and content gap analysis, so your dashboard can show not just where you're visible but where you're missing and why.
A proven template structure for AI visibility reporting
If you're building from scratch or adapting an existing template, here's a structure that works well for most use cases. It's organized into four pages, each serving a different audience or decision type.
Page 1: Executive overview
This page is for leadership. Keep it simple: three or four headline numbers with trend lines, and a competitor comparison chart.
Recommended metrics:
- Overall AI visibility score (your citation rate as a percentage of total prompts tracked)
- Week-over-week or month-over-month change
- Brand mention share vs top 3 competitors
- Top-performing AI model (where you're most visible)
Page 2: Model-by-model breakdown
This page is for the team doing the actual optimization work. Break down your citation frequency by AI model: ChatGPT, Perplexity, Gemini, Claude, Google AI Overviews, and any others you're tracking.
A heatmap works well here. Rows are prompts or prompt categories, columns are AI models, and cells show citation frequency. You can see at a glance which models are citing you and which aren't, and which prompt types are driving most of your visibility.
Page 3: Prompt performance
This is where you get into the specifics. A table showing each tracked prompt, your citation rate for that prompt, competitor citation rates, and a "gap score" (how much room there is to improve).
If your data source provides prompt volume estimates, include those too. A prompt where you're invisible but which has high volume is a much higher priority than a prompt where you're invisible but nobody's asking it.
Page 4: Traffic attribution
This page connects AI visibility to actual business outcomes. Sessions from AI referrers, conversion rates, and revenue (if you have e-commerce tracking). This is the page that justifies the investment.
The data for this page typically comes from GA4 or server logs, not from your AI visibility tool. You'll need to set up UTM parameters or use a dedicated attribution snippet to capture AI-referred traffic accurately.
Comparison: AI visibility tools with Looker Studio support
| Tool | Looker Studio connector | Pre-built template | API access | Content gap analysis | Traffic attribution |
|---|---|---|---|---|---|
| Promptwatch | Yes (integration + API) | Yes | Yes | Yes | Yes (snippet, GSC, logs) |
| Otterly.AI | Yes (native connector) | Yes | Limited | No | No |
| Peec AI | Community connector | Partial | Yes | No | No |
| Profound | API only | No | Yes (REST + SDKs) | Limited | No |
| Rankshift | No native connector | No | Limited | No | No |

Free vs paid templates: what's actually worth paying for
Most of the free templates available (from Google's gallery, Supermetrics' blog, or Data Bloo) are built for traditional marketing channels. They're well-designed and save time, but they don't have the field definitions or calculated metrics you need for AI visibility reporting.
Paid or tool-specific templates from AI visibility platforms are worth it if:
- You're reporting to clients or stakeholders who need a polished, consistent format
- You're tracking more than one brand or domain
- You need to combine AI visibility data with GA4 or Search Console data in the same view
If you're just getting started and want to understand what AI visibility data looks like before committing to a template, the free GA4 template from Data Bloo is a reasonable starting point for the traffic attribution layer. Build the AI visibility panels on top once you know what data you have.
Connecting your AI visibility data to Looker Studio
The connection method depends on your tool:
Native connectors (Otterly.AI): Go to Looker Studio, click "Add data," search for the connector by name, authorize it, and select your account. The connector handles field mapping automatically.
Community connectors (Peec AI): Same process, but search under "Partner connectors." You may need to review the field documentation separately to understand what each dimension and metric represents.
API-based connections (Profound, Promptwatch): You have two options. The simpler one is to use a third-party connector tool like Supermetrics or Coupler.io to pull from the API into Looker Studio. The more flexible option is to pipe the API data into Google Sheets first, then connect Looker Studio to the sheet. The Sheets approach is slower to refresh but requires no additional paid tools.
CSV exports: If your tool doesn't have a connector or API, you can export data as CSV and upload it to Google Sheets manually. This works, but it's not automated, so you'll need to update it before each report cycle.
Common mistakes when building AI visibility dashboards
A few things that consistently cause problems:
Mixing citation rate and mention count: These are different metrics. Citation rate (citations divided by total prompts tracked) is more meaningful for benchmarking, but mention count is easier to explain to non-technical stakeholders. Be explicit about which one you're showing.
Not segmenting by model: Aggregating across all AI models hides important patterns. A brand might be highly visible in Perplexity but invisible in ChatGPT. Those require different fixes.
Leaving out the baseline: A citation rate of 23% means nothing without context. Always show a comparison period, a competitor benchmark, or both.
Ignoring prompt intent: Not all prompts are equal. A prompt like "best CRM software" has different commercial intent than "what is CRM software." Segment by intent category if your data source supports it.
No traffic attribution: Visibility without traffic attribution is interesting but not actionable for business cases. Even a rough estimate of AI-referred sessions, pulled from GA4 referrer data, is better than nothing.
Recommended setup for agencies
If you're managing AI visibility reporting for multiple clients, the most efficient setup is:
- One master template with all four pages described above
- A separate data source connection per client (don't mix client data in the same data source)
- A report-level date range control so clients can adjust the window themselves
- Automated email delivery scheduled weekly or monthly
For the data pipeline, Promptwatch's API is worth looking at if you need to pull data for multiple domains into a single reporting workflow. The Looker Studio integration handles the visualization layer, and the API gives you flexibility for custom aggregations or combining data with other sources.
For teams that want monitoring-focused data without the optimization layer, Otterly.AI's native connector is the fastest path to a working dashboard.
Building the traffic attribution layer
This is the part most AI visibility dashboards skip, and it's the part that matters most for proving ROI.
AI search engines send referral traffic with varying levels of attribution clarity. Perplexity typically passes referrer data. ChatGPT's browsing feature does too, but not always consistently. Google AI Overviews traffic often appears as organic in GA4, making it hard to separate.
Three approaches, in order of accuracy:
-
Server log analysis: The most accurate method. AI crawlers and referrers show up in raw server logs. Tools like Promptwatch can analyze these logs to identify AI-referred sessions that GA4 misses.
-
GSC integration: Google Search Console captures some AI Overview click data. Connecting GSC to your Looker Studio dashboard gives you a partial picture of AI-driven organic traffic.
-
UTM parameters on cited content: If you know which pages are being cited (your AI visibility tool should tell you this), you can add UTM parameters to those URLs and track them in GA4. This only works for pages where you control the URL, but it's a practical workaround.
Final thoughts
The templates themselves are just containers. What makes an AI visibility dashboard useful is the quality of the underlying data and the clarity of the story it tells. A well-structured template helps with the second part. The first part depends on which tool you're using to collect the data.
If you're starting from scratch, pick a tool that exports to Looker Studio, copy or adapt one of the template structures above, and focus on getting the four core metrics right: citation frequency, brand mention share, prompt-level performance, and traffic attribution. Everything else is refinement.
The field is moving fast. Templates that were built six months ago may be missing metrics that matter now, like ChatGPT Shopping visibility or query fan-out data. Build your template with flexibility in mind, and plan to revisit the structure every quarter as the AI search landscape changes.