Key takeaways
- A good client-facing AI visibility dashboard shows share of voice, citation trends, and prompt-level performance — not just raw mention counts
- Looker Studio is free, shareable, and connects to most AI visibility data sources via native connectors or Google Sheets
- The most impressive dashboards combine AI visibility data with GA4 traffic and conversion data so clients can see the revenue connection
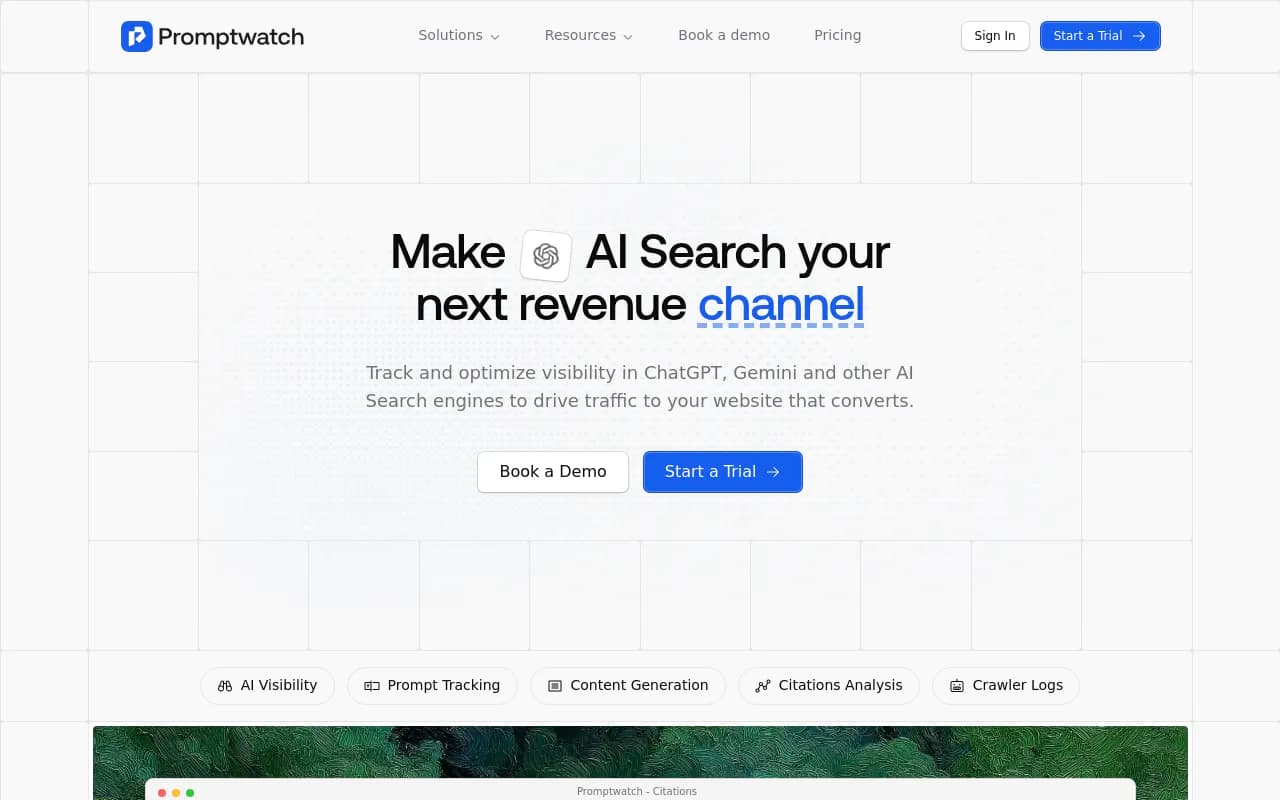
- Tools like Promptwatch offer a native Looker Studio integration, making it straightforward to pull structured AI visibility data directly into your reports
- Design matters as much as data — clean layouts with clear KPIs at the top convert skeptical clients into believers
Most agencies are still sending clients PDF reports with screenshots of AI mention counts. If that's you, this guide will change how you work.
AI search visibility is now a real budget line item for serious brands. Clients want to know: is ChatGPT recommending us? Are we losing ground to competitors in Perplexity? What's actually changing month over month? A well-built Looker Studio dashboard answers all of that in a single shareable link — no login required, always up to date, and professional enough to anchor a quarterly business review.
Here's how to build one that doesn't just look good but actually tells a story.
What belongs in an AI visibility dashboard
Before touching Looker Studio, get clear on what you're measuring. AI visibility reporting is still young, and a lot of dashboards end up being vanity metric collections. The metrics that actually matter to clients fall into three categories.
Presence metrics tell you whether the brand shows up at all. This includes mention rate (what percentage of relevant prompts return the brand), share of voice versus named competitors, and which AI models are citing the brand most often.
Quality metrics tell you how the brand appears. Sentiment scoring, whether the brand is mentioned first or buried in a list, and whether citations link to the right pages all belong here.
Business impact metrics close the loop. AI-referred traffic from GA4, conversion rates from AI sources, and revenue attribution (where available) turn an interesting report into a business case.
If your dashboard only has presence metrics, clients will eventually ask "so what?" Build all three layers in from the start.
Choosing your data sources
Looker Studio is only as good as the data you feed it. For an AI visibility dashboard, you're typically combining two or three sources.
AI visibility platform connector
This is the core data source. Several AI visibility platforms now offer native Looker Studio connectors, which means you can connect directly without exporting CSVs.
Promptwatch has a Looker Studio integration that pulls in prompt-level visibility data, share of voice by model, citation counts, and competitor comparisons. This is the cleanest setup because the data is already structured for reporting — you're not cleaning up raw exports.
Otterly.AI also released a Looker Studio connector in 2025, which pulls AI search visibility data directly into reports.
Otterly.AI

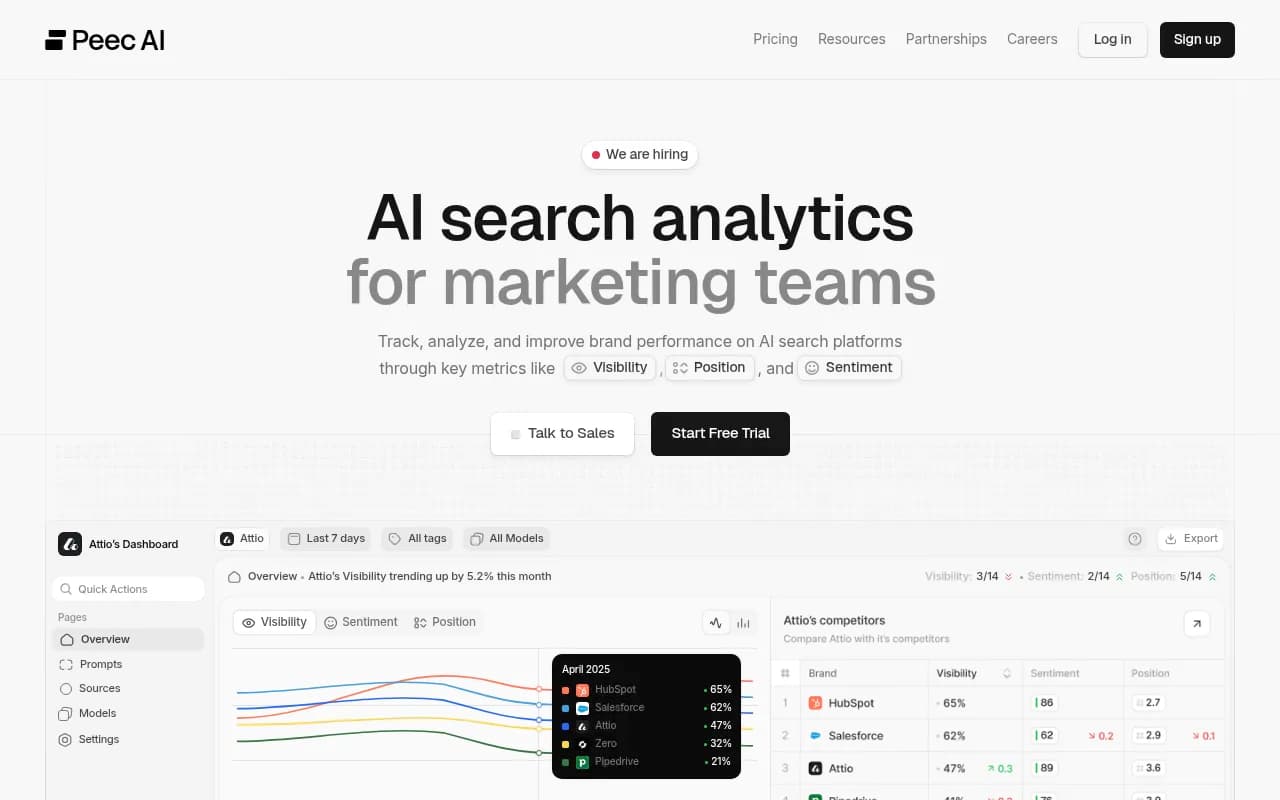
Peec AI has a connector as well, though the data model is simpler and lacks some of the prompt-level granularity you'd want for client reporting.
If your platform doesn't have a native connector, export to Google Sheets and connect that way. It's more manual but works fine for monthly reporting cadences.
GA4 for traffic attribution
Connect Google Analytics 4 as a second data source. You'll use this to show AI-referred sessions, engagement rates from AI traffic sources, and goal completions. GA4 natively identifies some AI referrers (Perplexity, ChatGPT browsing) in the traffic acquisition report — pull those dimensions through.
Google Search Console for context
Add GSC as a third source to show traditional organic performance alongside AI visibility. This helps clients see the full picture and understand whether AI visibility is additive or cannibalizing existing search traffic.
Setting up Looker Studio: the basics
If you haven't built a Looker Studio report before, the workflow is straightforward. Open Looker Studio, click "Create" then "Report," and connect your first data source. The canvas is blank — you're building from scratch.
A few settings to configure before you start adding charts:
- Set the report theme to match your agency or client branding. Use "Theme and Layout" in the top menu. A branded report feels intentional, not like a template.
- Set the default date range to "Last 30 days" or "Last 90 days" depending on your reporting cadence. Clients should see relevant data the moment they open the link.
- Enable "View" access only when sharing with clients. This prevents accidental edits.
For real-time or near-real-time data, the key is connecting sources that update automatically. GA4 and GSC update continuously. Most AI visibility platform connectors refresh daily. Set data freshness expectations in the report itself — a small text note like "AI visibility data refreshes every 24 hours" prevents confused client calls.
Building the dashboard: page by page
A strong client-facing AI visibility dashboard has three pages. Keep each page focused on one story.
Page 1: executive summary
This is what clients see first, and it needs to answer the "how are we doing?" question in under 10 seconds.
Put four scorecard tiles at the top of the page:
- Overall AI mention rate (this month vs. last month)
- Share of voice vs. top 3 competitors
- Number of AI models citing the brand
- AI-referred sessions (from GA4)
Below the scorecards, add a single trend line chart showing mention rate over the past 90 days. One chart, one line (or three if you're overlaying competitors). Don't crowd this page.
At the bottom, a simple bar chart showing share of voice by competitor works well here. Clients immediately understand competitive bar charts — they don't need a tutorial.
Page 2: prompt and model breakdown
This is where you show the detail behind the summary numbers. Clients who want to dig in come here; clients who just want the headline stay on page 1.
Key charts for this page:
- A table showing the top 20 prompts tracked, with mention rate and trend direction for each. Color-code the trend column (green for improving, red for declining) using conditional formatting in Looker Studio.
- A heatmap or grouped bar chart showing performance by AI model (ChatGPT, Perplexity, Gemini, Claude, etc.). This is genuinely interesting to clients — they often don't realize they're strong in one model and invisible in another.
- A sentiment breakdown if your data source provides it. A simple donut chart (positive / neutral / negative) works fine.
For the prompt table, use a calculated field to create a "trend" indicator. If your platform exports current period and previous period mention rates, a simple formula like Current - Previous gives you a delta column you can color-code.
Page 3: traffic and business impact
This page is what separates a good dashboard from a great one. Most AI visibility reports stop at mentions. This page connects mentions to money.
Pull in GA4 data here:
- Sessions by traffic source, filtered to show AI referrers. Create a custom segment or filter for sources containing "perplexity," "chatgpt," "claude," "gemini," and similar.
- Engagement rate and average session duration for AI-referred traffic vs. organic. In most cases, AI-referred visitors engage more deeply — show that.
- Goal completions or conversions attributed to AI traffic sources.
If you have e-commerce data or lead form tracking in GA4, add a revenue or lead volume metric here. Even a rough number like "23 leads from AI-referred traffic this month" changes the conversation with clients.
Design principles that make clients trust the data
A technically accurate dashboard that looks messy will get ignored. A few design rules that consistently work:
Keep the color palette to three colors maximum. Use your client's brand primary color for the main data series, a neutral gray for secondary data, and red only for negative trends or alerts. Anything more looks chaotic.
Use consistent chart types. If you use bar charts to show competitor comparisons on page 1, use bar charts for competitor comparisons on page 2. Switching chart types for the same type of data confuses readers.
Label everything. Don't assume clients know what "mention rate" means. Add a small text box near each key metric with a one-line definition. "Mention rate: the percentage of tracked prompts where your brand appeared in the AI response." Takes 30 seconds to add, saves 10 minutes of explanation on every call.
Leave white space. Dashboards that try to show everything show nothing. If you're tempted to add a seventh chart to a page, remove one instead.
Connecting AI visibility data to Looker Studio: a practical walkthrough
Here's the actual connection process for the most common setup (Promptwatch + GA4 + GSC):
- In Looker Studio, click "Add data" and search for the Promptwatch connector. Authorize it with your account credentials.
- Select the brand/project you want to report on. Choose the date range and prompt set you want to pull in.
- Add GA4 as a second data source. Use the native Google Analytics connector — it's in the default connector list.
- Add Google Search Console as a third source using the native connector.
- On each chart, use the "Data source" dropdown in the chart properties panel to select which source to pull from. Scorecards showing AI mentions pull from Promptwatch; traffic charts pull from GA4.
Blending data sources in Looker Studio (combining AI visibility and GA4 data in a single chart) is possible but requires a shared dimension — usually date. Use the "Blend data" feature carefully; it can produce misleading numbers if the date granularities don't match.
Comparison: AI visibility tools with Looker Studio support
Not all AI visibility platforms make Looker Studio integration easy. Here's how the main options compare:
| Tool | Looker Studio connector | Prompt-level data | Competitor data | Traffic attribution |
|---|---|---|---|---|
| Promptwatch | Yes (native) | Yes | Yes | Yes (GA4 + logs) |
| Otterly.AI | Yes (native) | Limited | Basic | No |
| Peec AI | Yes (native) | Basic | Basic | No |
| Profound | No (CSV export) | Yes | Yes | Limited |
| AthenaHQ | No (CSV export) | Yes | Yes | No |
| Scrunch AI | No (CSV export) | Limited | Basic | No |
For client reporting specifically, a native connector saves hours per month. CSV exports work but introduce a manual step that breaks when someone forgets to run the export before the client call.
Profound

Automating report delivery
Once the dashboard is built, set up automated email delivery so clients receive a summary without you lifting a finger.
In Looker Studio, go to "Share" then "Schedule email delivery." Set a weekly or monthly cadence, add the client's email, and choose whether to send the full report or a PDF snapshot. The PDF option is useful for clients who prefer something they can forward to their leadership team.
For agencies managing multiple clients, consider building a master template report and duplicating it per client. Change the data source connection for each copy. This takes about 10 minutes per client and keeps your reporting consistent across accounts.
[tool:zapier] can also trigger Looker Studio report exports via Google Drive if you need more complex automation — for example, sending a report only when a metric drops below a threshold.
Common mistakes to avoid
A few things that consistently make client dashboards worse:
Tracking too many prompts. If you're monitoring 200 prompts but only 20 are relevant to the client's core business, the noise drowns the signal. Start with 20-30 high-intent prompts and expand from there.
Showing raw mention counts instead of rates. If you tracked 50 prompts this month and 40 last month, a raw count comparison is meaningless. Always show mention rate (mentions / prompts tracked) so the metric is comparable period over period.
Ignoring model-level differences. A client might have strong visibility in Perplexity but be nearly invisible in ChatGPT. Aggregating across models hides this. Always show the model breakdown.
Not setting a baseline. The first month of data is just a baseline — there's nothing to compare it to. Set expectations with clients upfront that month 1 establishes the benchmark, and month 2 is when the story starts.
What a mature AI visibility reporting setup looks like
After a few months of consistent reporting, the dashboard evolves. You start seeing which content changes actually moved the needle on AI citations. You can show clients that the FAQ page you published in March is now being cited by Perplexity for three high-intent prompts. You can show that a competitor gained ground in ChatGPT after they published a comparison guide.
This is where tools like Promptwatch earn their keep beyond just monitoring. The Answer Gap Analysis feature identifies which prompts competitors are visible for that your client isn't — and the built-in content generation tools help create the pages that close those gaps. When you can show a client the gap, create the content, and then show the citation appearing in the dashboard six weeks later, that's a retention story that sells itself.
The Looker Studio dashboard is the client-facing layer. The work that drives the numbers happens in the platform behind it.
Final thought
The agencies winning AI visibility mandates in 2026 aren't the ones with the fanciest tools. They're the ones who can show clients a clear before/after story: here's where you were invisible, here's what we did, here's the traffic that came from it. A well-built Looker Studio dashboard makes that story visible every time a client opens their browser. Build it once, update the data automatically, and let the numbers do the talking.