Key takeaways
- AI referral traffic and citation rate are the two most foundational KPIs -- without them, you're flying blind on whether AI search is actually sending you visitors
- Visibility score alone is vanity; pair it with share of voice to understand competitive position
- Answer gap rate tells you where you're losing to competitors in AI responses -- it's the most actionable metric most dashboards skip entirely
- Prompt-level conversion rate is the hardest to build but the most valuable: it connects specific AI queries to revenue
- Looker Studio works well as the reporting layer, but you need a platform that exports structured AI data (citations, prompts, scores) to make it useful
AI search has changed the reporting game in ways most dashboards haven't caught up with yet. Traditional SEO dashboards track rankings, impressions, clicks from Google. That still matters. But in 2026, a meaningful chunk of your organic traffic discovery is happening inside ChatGPT, Perplexity, Claude, and Google AI Overviews -- and most Looker Studio setups have zero visibility into any of it.
The problem isn't Looker Studio. It's a great reporting tool. The problem is that most teams either aren't tracking AI visibility at all, or they're tracking the wrong things -- high-level "mention counts" that look impressive in a slide deck but don't connect to anything that matters.
This guide covers the seven KPIs worth building into your AI visibility Looker Studio dashboard, why each one matters, and how to think about sourcing the data.
Why Looker Studio for AI visibility reporting?
Before getting into the KPIs, a quick word on why Looker Studio makes sense here.
Most AI visibility platforms have their own built-in dashboards. They're fine for day-to-day monitoring. But when you need to share results with stakeholders, combine AI data with web analytics, or build a unified view across multiple channels, Looker Studio is the right layer. It's free, it connects to Google Analytics, Google Search Console, BigQuery, and third-party sources via community connectors, and it produces clean reports that non-technical stakeholders can actually read.
The catch: your AI visibility platform needs to export structured data. Not every tool does this well. Platforms like Promptwatch offer a Looker Studio integration and API, which makes it practical to pull citation data, prompt volumes, visibility scores, and competitor comparisons directly into your dashboard.
With that context, here are the seven KPIs.
KPI 1: AI referral traffic volume
This is the most basic metric and the one most teams are still missing. How many sessions are actually arriving from AI engines?
In Google Analytics 4, AI referral traffic shows up under referral sources -- you'll see domains like chatgpt.com, perplexity.ai, claude.ai, and gemini.google.com. The challenge is that not all AI-driven traffic is tagged this way. Some arrives as direct traffic (users copy a URL from an AI response and paste it into a browser). Some comes through dark social channels.
For your Looker Studio dashboard, build a scorecard showing total AI referral sessions, a week-over-week trend line, and a breakdown by AI engine. This gives you the most direct answer to "is AI search sending us traffic?"
What to watch: growth rate matters more than absolute volume in early stages. A brand going from 50 to 200 AI referral sessions per month is moving in the right direction even if the absolute number looks small.
KPI 2: Citation rate (brand mention rate)
Citation rate measures how often your brand or website appears in AI-generated responses when users ask relevant questions. It's usually expressed as a percentage: out of all the prompts you're tracking in your category, what share include a citation or mention of your brand?
This is different from traffic. An AI model might recommend your brand by name without including a clickable link. That still matters for brand awareness and downstream intent -- but it won't show up in your GA4 referral data.
The formula is simple:
Citation Rate = (Prompts where your brand is cited / Total prompts tracked) × 100
For your Looker Studio dashboard, show citation rate as a scorecard with a comparison to the previous period, plus a trend chart. If you're tracking multiple AI engines separately (ChatGPT, Perplexity, Gemini, etc.), break it down by engine -- citation rates vary significantly across models.
Tools like Promptwatch track citations across 10+ AI models and can export this data for Looker Studio reporting.
KPI 3: Share of voice vs. competitors
Citation rate tells you your absolute performance. Share of voice tells you your relative performance. In a category where all your competitors are gaining AI visibility, a flat citation rate is actually a decline.
Share of voice is calculated as:
Share of Voice = (Your citations / Total citations across all tracked brands) × 100
For your dashboard, a stacked bar chart works well here -- one bar per time period, showing each competitor's share. You can also use a heatmap to show which AI engines favor which brands.
This is where competitor data becomes essential. You need a platform that's tracking not just your citations but your competitors' citations across the same prompt set. Most basic monitoring tools don't do this at scale.
Otterly.AI

KPI 4: Answer gap rate
This is the metric most teams skip, and it's arguably the most actionable one on this list.
Answer gap rate measures the percentage of relevant prompts where a competitor is cited but you're not. It's a direct signal of missed opportunities -- the specific questions your potential customers are asking AI engines, where your brand is invisible but your competitors are visible.
Answer Gap Rate = (Prompts where competitor cited, you're not / Total tracked prompts) × 100
A high answer gap rate tells you exactly where to focus content creation. If ChatGPT consistently recommends three competitors when users ask "what's the best [your category] for [use case]" and your brand never appears, that's a content gap -- your website probably doesn't have a strong enough answer to that specific question.
For your Looker Studio dashboard, show answer gap rate as a scorecard, then include a table of the specific prompts driving the gap. This turns a KPI into a to-do list.
Platforms like Promptwatch include answer gap analysis as a core feature -- it shows you the exact prompts where competitors are winning and you're not, then connects directly to content generation tools to help you close those gaps.
KPI 5: AI Overview inclusion rate
Google AI Overviews are a separate beast from conversational AI engines like ChatGPT and Perplexity. They appear at the top of Google search results and are generated from web content Google has indexed. Getting included in an AI Overview is closer to traditional SEO than it is to citation tracking.
AI Overview inclusion rate measures what percentage of your tracked keywords trigger an AI Overview that includes your content as a source.
This matters because AI Overviews are getting more prominent in Google search results, and inclusion drives both brand visibility and click-through. According to tracking data from multiple GEO platforms, AI Overview inclusion correlates with higher organic CTR on the pages that get cited.
For your Looker Studio dashboard, track inclusion rate over time and segment by topic cluster. This helps you identify which content areas are performing well in AI Overviews vs. which need work.
KPI 6: Page-level citation performance
Aggregate citation rate is useful for executive reporting. But for the content team, you need page-level data: which specific pages on your site are being cited by AI engines, how often, and by which models?
This metric answers a few important questions:
- Which content formats are AI engines citing most (guides, comparison pages, listicles, product pages)?
- Which pages are driving AI referral traffic vs. being cited without generating clicks?
- Which pages have dropped out of AI citations after a content update?
For your Looker Studio dashboard, build a table with page URL, citation count by engine, AI referral sessions, and a trend indicator. Sort by citation count descending. Pages at the top are your AI visibility assets -- protect them. Pages that used to appear and have dropped are worth investigating.
This is one area where crawler log data becomes useful. Knowing which pages AI crawlers are actually visiting (and how often) gives you a signal about what's likely to get cited. Promptwatch's AI crawler logs show exactly which pages ChatGPT, Claude, Perplexity, and other AI crawlers are reading -- which pages they hit, errors they encounter, and how frequently they return.
KPI 7: Prompt-level conversion rate
This is the hardest KPI to build and the most valuable. It answers the question: when a user discovers your brand through an AI engine response and visits your site, what do they do?
Prompt-level conversion rate connects specific AI queries to business outcomes. A user who found you because ChatGPT recommended you for "best project management tool for remote teams" might convert at a very different rate than one who found you through a generic brand mention.
The setup requires:
- UTM parameters or server log analysis to identify AI referral sessions
- Goal tracking in GA4 (form fills, purchases, sign-ups)
- A way to connect the originating prompt to the session (this is the hard part)
For most teams, a practical starting point is measuring conversion rate by AI engine rather than by individual prompt. Build a table in Looker Studio showing sessions, conversions, and conversion rate for each AI referral source. This alone is more than most teams have.
For more granular prompt-level attribution, platforms like Promptwatch offer traffic attribution via code snippet, Google Search Console integration, or server log analysis -- which gets you closer to connecting specific prompts to actual revenue.
Putting it together: dashboard structure
Here's a practical layout for your Looker Studio AI visibility dashboard:
| Section | Metrics | Chart type |
|---|---|---|
| Executive summary | AI referral sessions, citation rate, share of voice | Scorecards with period comparison |
| Competitive position | Share of voice by engine, answer gap rate | Stacked bar, competitor table |
| Content performance | Page-level citations, AI Overview inclusion | Sortable table with trend indicators |
| Traffic & conversion | AI referral sessions by engine, conversion rate | Line chart + conversion table |
| Opportunity pipeline | Top answer gaps by prompt | Table with competitor data |
Keep the executive summary at the top -- one row of scorecards that answers "are we growing?" at a glance. Everything below is for the people who need to act on the data.
Data sources and tooling
Getting this dashboard built requires structured data exports from your AI visibility platform. Not every tool makes this easy.
Here's a quick comparison of how major platforms handle Looker Studio integration:
| Platform | Looker Studio connector | API | Citation data | Competitor data |
|---|---|---|---|---|
| Promptwatch | Yes (via API + integration) | Yes | Yes (880M+ citations) | Yes |
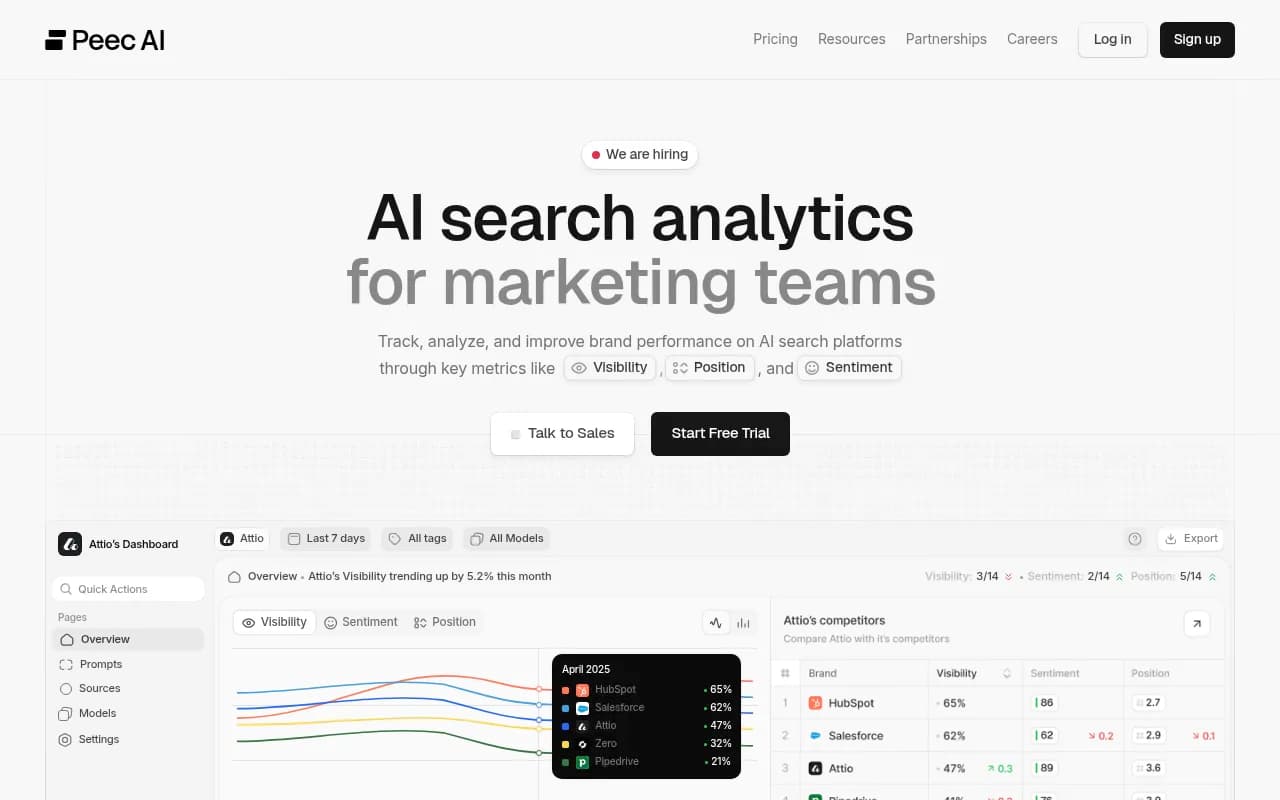
| Peec AI | Community connector | Limited | Yes | Partial |
| Otterly.AI | Manual export | No | Basic | No |
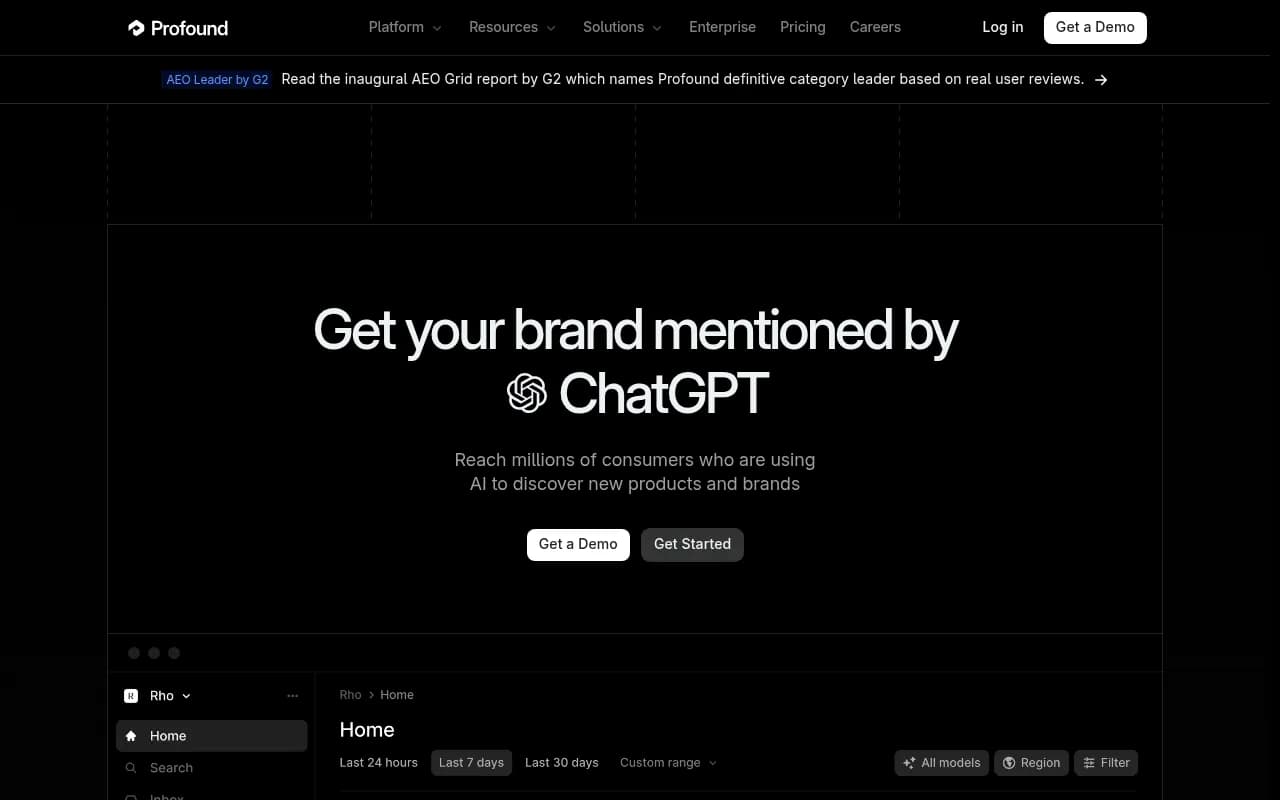
| Profound | REST API + SDKs | Yes | Yes | Yes |
| AthenaHQ | Manual export | Limited | Yes | Partial |
For teams that want a full Looker Studio setup without heavy engineering, Promptwatch's integration is the most direct path -- it exports citation data, prompt volumes, visibility scores, competitor comparisons, and traffic attribution in a format that maps cleanly to the KPIs above.
Profound

A note on what to skip
A few metrics that look appealing but tend to create noise:
- Raw mention count without context (a brand mentioned negatively or in passing isn't the same as a citation)
- "AI visibility score" as a standalone metric without knowing what's in the calculation
- Keyword rankings in traditional SERPs as a proxy for AI visibility (they correlate poorly)
The seven KPIs above are enough. More metrics usually means more time spent explaining the dashboard and less time acting on it.
Getting started
If you're building this from scratch, start with KPIs 1 and 2 -- AI referral traffic from GA4 and citation rate from your AI visibility platform. Those two alone will tell you more than most teams currently know.
Add share of voice and answer gap rate once you have baseline data. Those two KPIs together will tell you where to focus your content efforts.
Page-level citation performance and prompt-level conversion rate come last -- they require more setup but deliver the clearest picture of what's actually working.
The goal is a dashboard that a marketing director can read in 90 seconds and a content strategist can use to prioritize their week. Seven KPIs, structured clearly, updated automatically. That's the target.