Key takeaways
- Agentic GEO shifts the measurement question from "are we mentioned?" to unit economics: how much does each citation cost, how fast do new pages start earning mentions, and how much content can your system ship per week?
- Time to first mention has real benchmarks: Perplexity cites new content in 1-2 weeks, most platforms in 4-8 weeks, ChatGPT can take 6-12 weeks. If your agents beat these windows, the machine is working.
- Cost per citation is the most defensible ROI number you can put in front of a CFO. It forces you to account for tool spend, content production, and human review in one figure.
- Content velocity matters because citations decay: half of everything cited in AI answers is less than 13 weeks old. If your output drops, your visibility drops with a lag.
- Volatility is normal. AI citations swing 40-60% month to month, so judge these metrics on quarterly trends, not weekly noise.
Why agentic GEO broke the old measurement model
For the last two years, GEO reporting has been mostly a tracking exercise. You picked 50 prompts, ran them against ChatGPT and Perplexity, and reported a visibility score. That was fine when GEO was a human workflow: a strategist picked topics, a writer produced an article, someone published it, and months later you checked whether it moved the needle.
Agentic GEO inverts this. The agents plan, write, publish, and reprioritize on their own. Vodafone UK's GEO agent, for example, eliminated 20 hours of manual work per week from its demand generation team and saved the broader marketing team 8 hours per person weekly. Crisp scaled from handcrafted articles to 5-10 published pieces per day using automated content agents. When the work becomes continuous and largely automated, a monthly visibility score stops being sufficient. You need throughput metrics and unit economics, the same way a factory tracks parts per hour and cost per unit.
That's what this guide is about: the three metrics that actually tell you whether your agentic GEO system is working, plus the supporting numbers that make those three meaningful.
Metric 1: Time to first mention
Time to first mention (TTFM) is the number of days between publishing a piece of content and the first time an AI engine cites it, mentions your brand off the back of it, or otherwise uses it in an answer.
It's the agentic GEO equivalent of indexation speed in traditional SEO. Fast TTFM means your content pipeline is well-tuned: the agents are producing the formats AI engines like to quote, your site is crawlable by the right bots, and the topics you're targeting have room in them. Slow TTFM means something upstream is broken, and it's usually one of three things.
What the benchmarks look like
From published GEO data, the windows vary a lot by platform:
| Platform | Typical time to first citation | Why |
|---|---|---|
| Perplexity | 1-2 weeks | Heavy recency bias, favors fresh content |
| Most AI engines (blended) | 4-8 weeks | Standard knowledge refresh cycles |
| ChatGPT | 6-12 weeks | Updates its retrieval and knowledge base less frequently |
GrackerAI's published case studies show initial improvements within 4-6 weeks after structured content changes, with significant citation increases at 2-3 months. If your agentic system is publishing on Monday and earning first mentions inside 14 days, you're ahead of the curve. If a page hasn't been cited after 90 days, the honest answer is it probably won't be, and a good agentic workflow should flag it for a rewrite or consolidation rather than letting it rot.
How to measure it properly
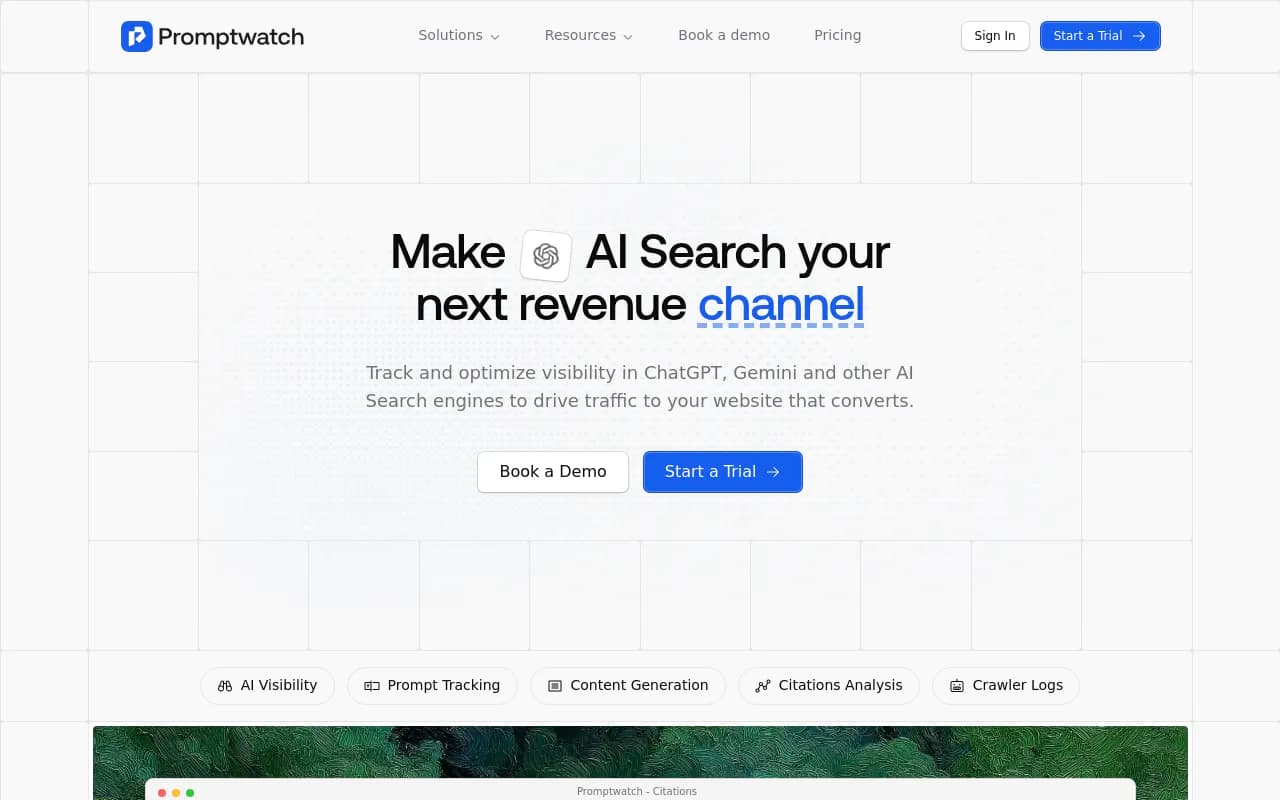
Log the publish date for every article your agents produce. Then, when a citation appears, record the delta. The cleanest way to do this at scale is a platform that tracks citations per page with dates, which is exactly what citation-trend reporting in tools like Promptwatch is built for: it shows which of your pages get cited, when citations ramp up, and when they decay, per page.
One warning: don't measure TTFM against a single engine. A page can get picked up by Perplexity in nine days and completely ignored by ChatGPT for two months. Track it per platform and report the blended number as a range, not an average, because the spread itself is informative.
What moves TTFM
The Princeton/IIT Delhi GEO research found that answer-first structure correlates with up to a 40% lift in citation frequency. A MaxAEO study of 3,200 cited passages found FAQ sections have the highest citation probability of any format at 81%, with statistic lines pulling 3.4x more citations than plain narrative and definition sentences 3.1x. If your agents are producing conversational, opinion-style prose and your TTFM is slow, that's your first suspect. Configure them to lead with a direct answer in the first 40-60 words and to pack in cited data points.
Metric 2: Cost per citation
This is the metric that ends arguments in budget meetings.
Cost per citation is your total GEO program cost divided by the number of citations, mentions, or answer-presence events you earned in the same period:
Cost per citation = (tool spend + content production cost + human review + agency/overhead) / citations earned
The reason this number matters now, in 2026, is that agentic GEO has made the numerator genuinely interesting. Pre-agents, GEO content was expensive: a strategist, a writer, an editor, maybe $500-2,000 per article with no guarantee of a citation. With agents doing the drafting and publishing, the marginal cost per article collapses, which means your cost per citation should be falling quarter over quarter if the system is healthy. If it's flat or rising, either your agents are producing content that doesn't get cited, or your human review layer has become the bottleneck and is eating all the savings.
Getting the denominator right
The denominator is where most teams mess this up. A raw citation count is nearly meaningless without segmenting it:
- Citations on prompts you're actively targeting, versus incidental mentions on prompts you never planned for. Both count, but only the first measures your system's aim.
- Citation rate versus volume. Citation rate is the percentage of tracked prompts where an AI engine names or links your brand. Frequency is how many times you appear per answer. Contently's GEO measurement framework treats citation rate as the foundational KPI because citation precedes everything downstream, and one study found adding citations produced a 115% visibility increase for mid-ranked pages.
- Quality of the mention. A citation in a recommendation paragraph is worth more than a footnote mention. Crackle PR's 2026 benchmark suggests brand positioning and capability descriptions should be accurate 80%+ of the time when AI mentions you; inaccurate mentions are a liability, not an asset.
What to compare it against
Cost per citation only has meaning next to a reference point. The most useful comparisons:
- Cost per visit from AI-referred traffic (perplexity.ai, chatgpt.com, claude.ai as referrers in your analytics). AI search visits grew 42.8% year over year, from 15.6 billion in Q1 2025 to 27.4 billion in Q1 2026, while Google search visits grew just 2.4%, so this channel is getting cheaper to win relative to its growth.
- Your cost per link in traditional digital PR, which for most campaigns runs well into three figures.
- Conversion value. Crisp found 2x higher conversion rates from AI traffic versus traditional channels, which means a nominally higher cost per citation can still be the better economics if those citations convert.
A platform that tracks actual AI-referred visitors and conversions, not just mentions, is what makes this comparison possible. This is the practical difference between a prompt tracker and a full visibility stack: trackers tell you a mention happened, platforms like Promptwatch connect it to crawl logs (so you know why), cited URLs (so you know where), and visitor analytics (so you know what it produced). If you can't trace a citation to traffic, you can't compute cost per outcome, and the whole ROI story stays hand-wavy.
Metric 3: Articles per week (and the citation win rate behind it)
Articles per week is the throughput metric of agentic GEO. On its own it says nothing. Combined with citation win rate, it says everything.
The dynamic that makes velocity non-negotiable is citation decay. Seer Interactive's study found 50% of content cited in AI answers is less than 13 weeks old. Kevin Indig's State of AI Search Optimization 2026 report found pages not updated quarterly are 3x more likely to lose their AI citations entirely, and content updated within 30 days earns 3.2x more citations than older content. Your visibility is a bathtub with the drain open, and articles per week is the faucet.
What a healthy number looks like
There's no universal target; it scales with site size and topic breadth. But some reference points help:
- A solo human workflow typically sustains 1-4 GEO-optimized articles per week.
- A team with content agents publishing to a CMS can sustain 5-10 per day in the upper range, which is what Crisp reached.
- A useful content density heuristic from the GEO guides: a 3,000-word article should carry 15-20 cited data points, and a pillar page should target 5-8 key answer blocks.
The number I'd actually watch, though, is citations earned per article published, your citation win rate. Shipping 40 articles a week that never get cited is not throughput, it's landfill. A system producing 8 articles a week where 3 earn citations is beating one producing 40 where 2 do. And this is where agentic platforms earn their keep: content gap analysis tells the agents what to write based on what AI answers are actually missing, instead of guessing. Monks, for instance, uses answer-gap reports to build content roadmaps for enterprise clients precisely so output maps to citable gaps.
The update cadence is part of the metric
Articles per week shouldn't only count net-new content. Refreshes count. Given that content updated within 90 days achieves roughly 2x higher citation rates than stale content, a healthy agentic system splits its weekly output between new pages and refreshes of pages whose citations are decaying. If your platform shows citation ramp-up, peak, and decay per page, you can prioritize refreshes by revenue at risk rather than by gut feel.
The supporting metrics that make the three core numbers honest
The three metrics above are the headline, but they need context. Four supporting numbers do that job:
| Supporting metric | What it tells you | Cadence |
|---|---|---|
| Citation rate (tracked prompts) | Whether optimization work is taking hold, overall aim | Weekly |
| Share of model vs. named competitors | Whether you're winning or the category is just growing | Monthly |
| AI referral traffic and conversions | Whether citations translate into business outcomes | Weekly |
| Citation decay rate | How fast your visibility drains without fresh content | Monthly |
Citation rate and AI referral traffic move fast, so they suit weekly reporting. Share of model and decay trends are better read month-over-month, because of the volatility problem: AI visibility swings 40-60% month to month as models retrain and context windows shift. A bad week means nothing. A bad quarter means something.
If you want a deeper treatment of the full KPI funnel, Contently's measurement guide and the enterprise GEO guide from Writer both walk through citation rate, AI share of voice, referral traffic, and conversion value in detail:

Choosing the tooling that can actually measure this
Here's the uncomfortable part: most AI visibility tools on the market can't measure the three metrics in this guide. Prompt trackers tell you whether a brand was mentioned, on a fixed prompt set, usually without page-level citation data, without traffic attribution, and without any concept of cost. That's fine for a quarterly brand check. It cannot tell you your time to first mention, because it doesn't know which page got cited when. It cannot tell you cost per citation, because it never connects to your analytics. And it can't influence articles per week, because it doesn't produce anything.
A quick comparison of what different categories of tooling can and can't measure:
| Tool category | Examples | TTFM | Cost per citation inputs | Throughput/content production |
|---|---|---|---|---|
| Prompt trackers | Otterly.AI, Peec AI | Partial (no page-level dates) | Mentions only, no traffic data | None |
| Monitoring platforms | Profound, Scrunch AI | Yes, page tracking | Mentions + some traffic | None or limited |
| SEO suites with AI add-ons | Semrush, Ahrefs Brand Radar | Fixed prompt sets | Shallow AI-specific data | Separate tools required |
| End-to-end GEO platforms | Promptwatch | Yes, per-page citation trends | Crawler logs, cited URLs, visitor analytics, conversions | Content agents with CMS publishing |
For the record, here are the monitoring-side tools worth knowing regardless of what you pick:
Otterly.AI is a solid entry-level option for tracking brand mentions across ChatGPT, Perplexity, and Google AI Overviews if all you need is visibility trending.
Otterly.AI

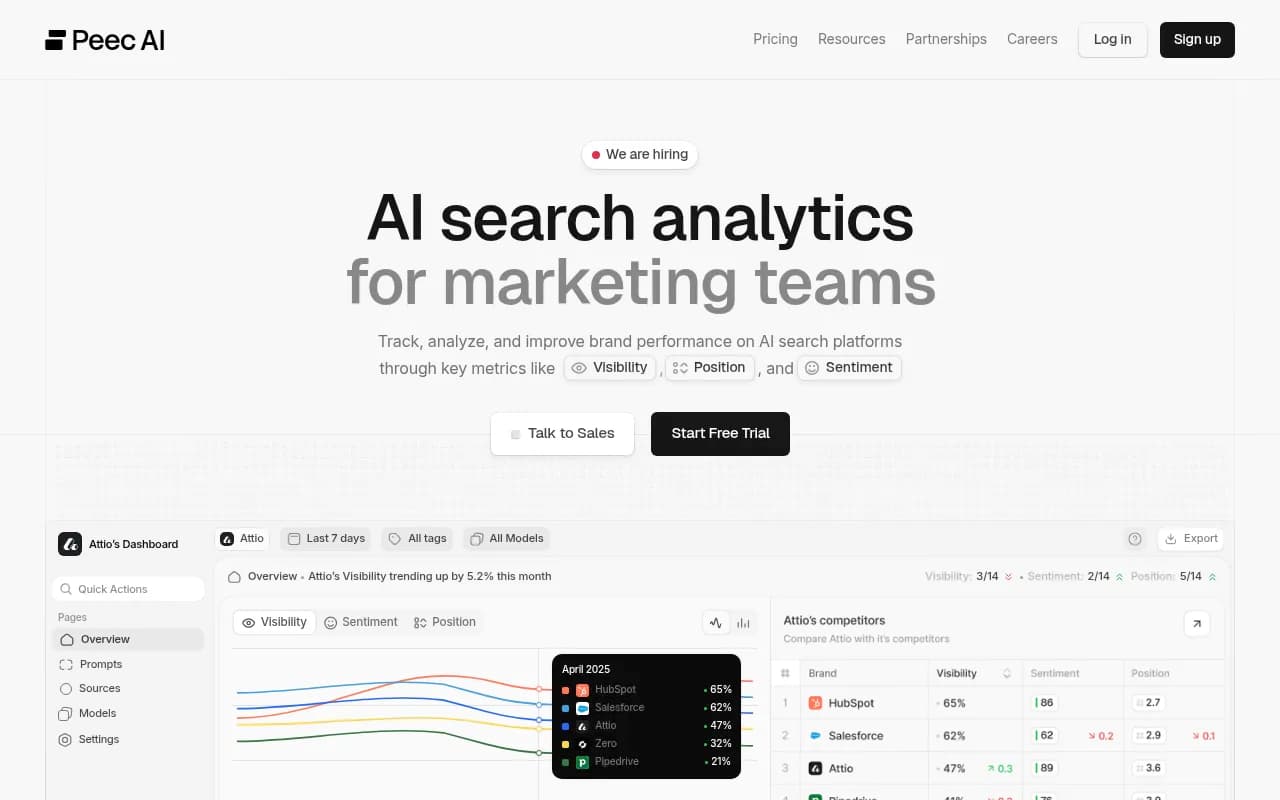
Peec AI covers the same monitoring ground for marketing teams that want a simpler dashboard.
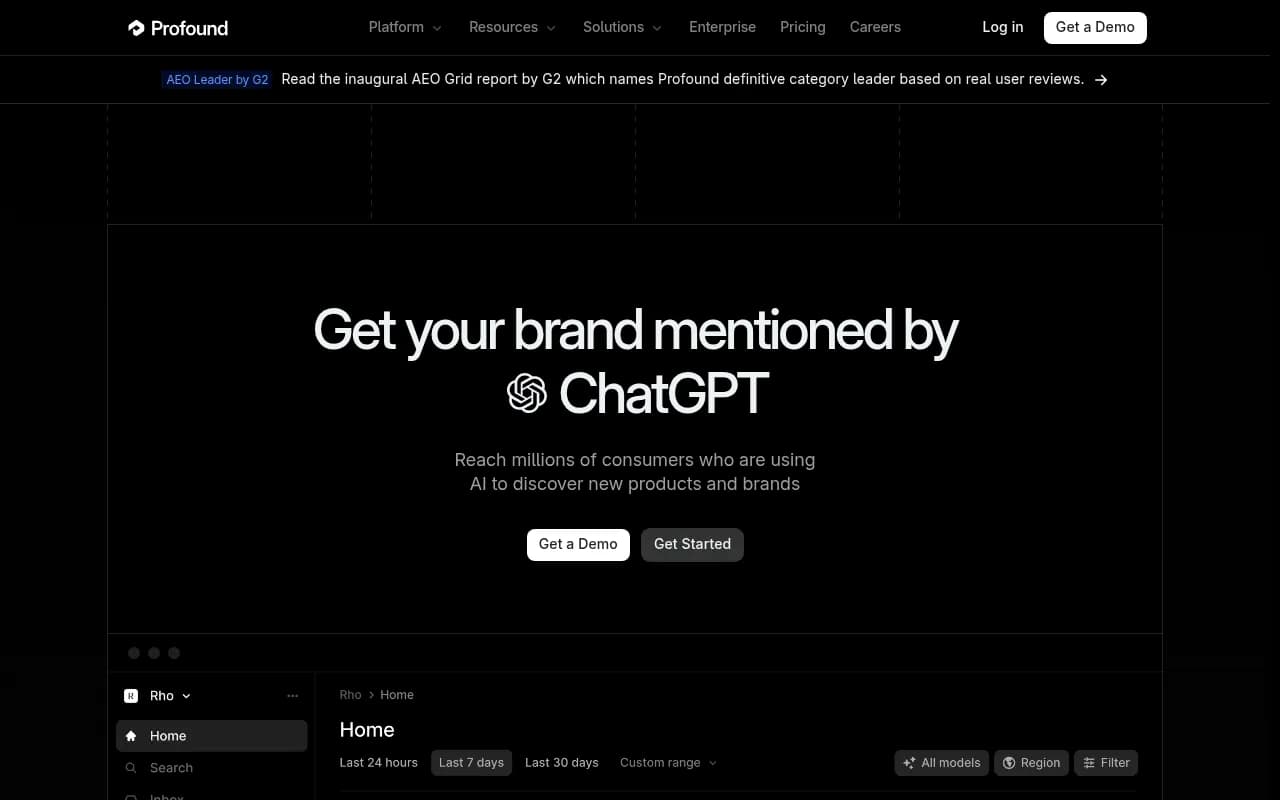
Profound is the enterprise monitoring choice, tracking mentions across 9+ AI search engines.
Profound
And Promptwatch remains the platform we recommend when you want the full loop: prompt tracking with volumes and difficulty, citation trends per page, AI crawler logs showing when ChatGPTBot and friends visit your pages and what they read, visitor analytics from AI platforms, and content agents that plan, write, and publish GEO-optimized content directly to Webflow, Framer, or WordPress. It's the difference between watching the scoreboard and having a team on the field.
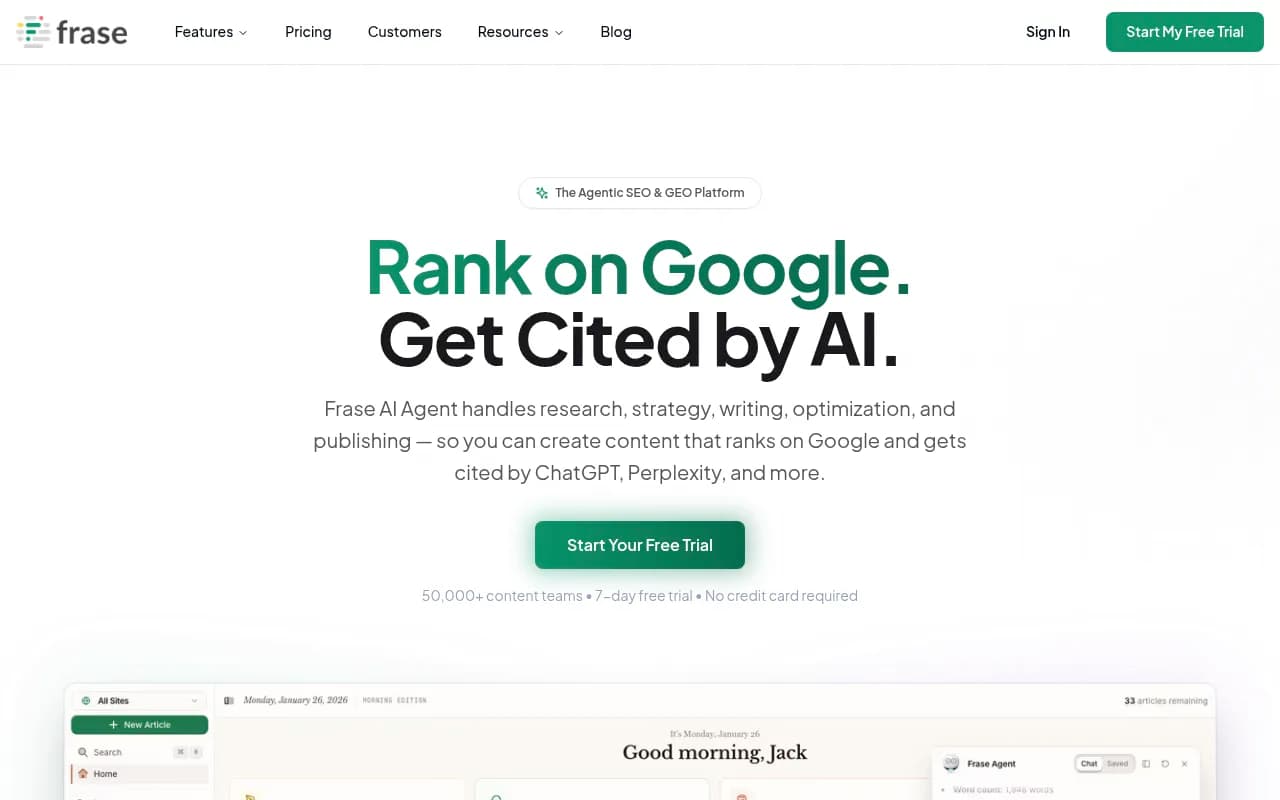
If you're also retooling your content side, Frase remains useful for research and briefs on the human-workflow end of the spectrum:
A sample reporting cadence for agentic GEO
Pulling all of this together, here's a cadence that works for most teams:
- Weekly: articles published (new + refreshes), time to first mention for the week's cohort, citation rate on tracked prompts, AI-referred traffic. The first three are your agentic system's vital signs.
- Monthly: citations earned, cost per citation (computed quarterly as a trend but with monthly snapshots), share of model vs. competitors, sentiment and accuracy of mentions.
- Quarterly: the real verdict. Cost per citation trend, blended TTFM trend, total AI-sourced conversion value, and a content audit of pages whose citations have decayed past recovery.
The quarterly view is the one that proves or disproves the whole agentic investment. If cost per citation is falling, TTFM is stable or shrinking, and AI-sourced conversions are growing while your human hours on the workflow drop, the agents are working. If two of those three are moving the wrong way, you don't have a measurement problem, you have a system problem, and no reporting framework will fix it.
The pitfalls to watch for
Three failure modes show up constantly in 2026 GEO reporting:
Vanity mention counting. Reporting raw mention volume without prompt segmentation or traffic attribution. A spike in mentions on low-intent prompts is not a win, it's noise that happens to be flattering.
Judging on monthly swings. With 40-60% monthly variance in citations being normal, a month-over-month decline is not evidence of failure. Teams that react to single-month drops by rewriting their whole content strategy usually destroy whatever was working.
Counting output without counting outcomes. Articles per week as a standalone metric invites content farming. The whole point of agentic GEO is that agents close the loop between gap analysis and publishing; if you only measure the publishing half, you've rebuilt the content farm with better machinery.
The bottom line
Cost per citation, time to first mention, and articles per week are the three numbers that make agentic GEO legible to the people funding it. They translate "we deployed AI agents" into "each citation costs us $34, down from $89, and new pages earn their first mention in 12 days." That's a sentence a CFO can act on. Set your baselines before you switch on the agents, review weekly, judge quarterly, and let the unit economics, not the mention count, tell you whether the machine deserves more budget.