Key takeaways
- Looker Studio is free and flexible enough to build a proper multi-model AI visibility dashboard, but you need the right data source feeding it
- The most useful metrics to track are mention rate, sentiment, citation share, and prompt-level visibility per model
- Tools like Promptwatch and Otterly.AI offer native Looker Studio connectors or API exports that make data ingestion straightforward
- Comparison charts (bar, line, heatmap-style tables) work better than scorecards alone when comparing across 5+ AI models
- The report is only as good as the prompts you're tracking — prompt selection is the most important decision you'll make
If you're trying to understand how your brand performs across ChatGPT, Perplexity, Gemini, Claude, and the rest, a spreadsheet isn't going to cut it for long. You need something you can share with a client or a CMO, something that updates automatically, and something that makes the differences between models immediately obvious.
Looker Studio is the right tool for this. It's free, it connects to almost anything, and the output looks professional without requiring a data engineering team. This guide walks through the full process: what data you need, how to get it in, and how to structure the report so it's actually useful.
What you're trying to show
Before touching Looker Studio, be clear on what the report needs to answer. A multi-model AI visibility comparison report should answer three questions:
- Which AI models mention your brand, and how often?
- How does your visibility compare to competitors across those models?
- Which specific prompts are driving (or missing) visibility?
Everything else — sentiment breakdowns, citation source analysis, trend lines over time — is useful context, but those three questions are the core.
Step 1: Choose your data source
This is the most important decision. Looker Studio is just a visualization layer. The quality of your report depends entirely on what's feeding it.
You have a few options:
Option A: Use a GEO platform with a native Looker Studio connector
Some AI visibility platforms have built Looker Studio connectors that let you pull data directly without exporting anything manually. Otterly.AI has a community connector with documented fields. LLM Pulse has pre-built Looker Studio dashboard templates.
Option B: Use a platform with an API and pipe data into Google Sheets or BigQuery
Platforms like Promptwatch and Profound offer REST APIs. You can use a tool like Zapier or n8n to schedule regular pulls into a Google Sheet, which Looker Studio connects to natively. This gives you more control over the data structure.
Profound
Option C: Export CSVs manually and upload to Google Sheets
This works for one-off reports but breaks the moment you want automated refresh. Avoid it if you're building something you'll use more than once.
For most teams, Option B is the best balance of flexibility and reliability. Set up a Google Sheet with a structured schema, automate the data pull with a weekly or daily trigger, and connect Looker Studio to that sheet.
Step 2: Define your data schema
Before you build anything in Looker Studio, your data needs a consistent structure. Here's a schema that works well for multi-model comparison reports:
| Column | Type | Example |
|---|---|---|
| date | Date | 2026-03-15 |
| ai_model | Text | ChatGPT |
| prompt | Text | "best project management tools" |
| brand_mentioned | Boolean | TRUE |
| mention_position | Number | 2 |
| sentiment | Text | Positive |
| competitor_mentioned | Text | Notion |
| citation_url | Text | https://yoursite.com/page |
| visibility_score | Number | 0.72 |
The ai_model column is what makes multi-model comparison possible. Every row should be tagged with which model generated the response. Without this, you can't split or filter by model in Looker Studio.
If you're pulling from a platform like Promptwatch, this structure is already handled for you — the export or API response includes model-level attribution. If you're building your own tracking setup, you'll need to enforce this schema manually.
Step 3: Connect your data to Looker Studio
Open Looker Studio and create a new report. Click "Add data" and select your source:
- If you're using Google Sheets, select the Google Sheets connector and point it to your tracking sheet
- If you're using BigQuery, select the BigQuery connector and write a simple query that pulls your visibility data
- If you're using a native connector (like Otterly.AI's community connector), search for it in the connector library
Once connected, Looker Studio will auto-detect your fields. Check that date fields are recognized as dates, numeric fields as numbers, and text fields as dimensions. Mistyped fields are the most common cause of broken charts.
Step 4: Build the report structure
A good multi-model AI visibility report has four sections. Here's how to structure them:
Section 1: Summary scorecards
At the top of the report, add scorecards for your headline metrics:
- Overall mention rate (% of prompts where your brand appeared)
- Average visibility score across all models
- Number of prompts tracked
- Number of AI models covered
For each scorecard, enable the comparison feature in the Properties panel under the SETUP tab. Set the comparison period to "previous period" so stakeholders can immediately see whether things are improving or declining.
Section 2: Model-by-model comparison table
This is the heart of the report. Create a table with:
- Rows: AI models (ChatGPT, Perplexity, Gemini, Claude, Grok, etc.)
- Columns: Mention rate, average position, sentiment score, citation count
Add conditional formatting to the mention rate column so high values show green and low values show red. This makes it immediately obvious which models your brand is winning and losing.
Here's what a sample comparison table might look like:
| AI model | Mention rate | Avg. position | Positive sentiment | Citations |
|---|---|---|---|---|
| ChatGPT | 68% | 2.1 | 74% | 142 |
| Perplexity | 81% | 1.8 | 82% | 203 |
| Gemini | 44% | 3.4 | 61% | 87 |
| Claude | 52% | 2.7 | 78% | 119 |
| Grok | 31% | 4.1 | 55% | 41 |
Numbers like these tell a clear story: you're doing well in Perplexity, struggling in Grok and Gemini. That's the kind of insight that drives action.
Section 3: Trend lines over time
Add a line chart with date on the x-axis and mention rate on the y-axis. Use the ai_model field as a breakdown dimension so each model gets its own line.
This chart answers the question: "Is our visibility improving, and is it improving equally across all models?" Often you'll find that a content change or new page lifted you in one model but had no effect on others. That's worth knowing.
Set the date range control at the top of the report to apply to all charts, so viewers can switch between 30-day, 90-day, and custom windows without breaking anything.
Section 4: Prompt-level breakdown
This is where the report gets genuinely useful for optimization work. Create a table showing:
- Each tracked prompt
- Which models mentioned your brand for that prompt
- Your position in each model's response
- Competitor mentions for the same prompt
Filter this table to show only prompts where your brand was NOT mentioned in at least one model. These are your gaps — the prompts where competitors are visible and you're not. This is the section that should drive your content calendar.
Step 5: Add competitor comparison
If your data includes competitor tracking (most GEO platforms do), add a bar chart comparing your mention rate vs. your top 3 competitors, broken down by AI model.
Use a grouped bar chart with ai_model as the dimension and one metric series per brand. This makes it easy to see, for example, that you're ahead of Competitor A in ChatGPT but behind them in Gemini.

Step 6: Apply filters and controls
Add these controls to make the report interactive:
- Date range control (applies to all charts)
- AI model filter (lets viewers focus on one model at a time)
- Prompt category filter (if you've tagged prompts by topic or funnel stage)
- Sentiment filter (positive / neutral / negative)
Place controls at the top of the report in a dedicated filter bar. Group them visually so it's obvious they affect the charts below.
Step 7: Design for readability
A few things that make the difference between a report people use and one they ignore:
- Use a consistent color scheme. Assign a fixed color to each AI model and use it throughout. ChatGPT might be green, Perplexity purple, Gemini blue. Consistency reduces cognitive load.
- Keep chart titles descriptive. "Mention rate by AI model" is better than "Chart 3."
- Add text annotations for significant changes. If visibility dropped in March, add a text box explaining why (algorithm update, new competitor, content change).
- Use white space. Cramming too many charts onto one page makes everything harder to read.
Automating the refresh
The report is only useful if the data stays current. Set up an automated refresh so your Google Sheet (or BigQuery table) updates on a regular schedule.
If you're using Zapier or n8n to pull from an API:
Set a daily or weekly trigger that calls your GEO platform's API, transforms the response into your schema, and appends rows to the Google Sheet. Looker Studio will pick up the new data automatically on the next view.
If you're using a platform with a native connector, check whether it supports scheduled refresh. Some connectors update in real time; others require a manual refresh.
Choosing the right AI visibility platform for this workflow
The report structure above works with any platform that can export structured data. But some platforms make this significantly easier than others.
| Platform | Looker Studio connector | API access | Model coverage | Content gap analysis |
|---|---|---|---|---|
| Promptwatch | Via API / Google Sheets | Yes (REST API) | 10 models | Yes |
| Otterly.AI | Native connector | Limited | 5 models | No |
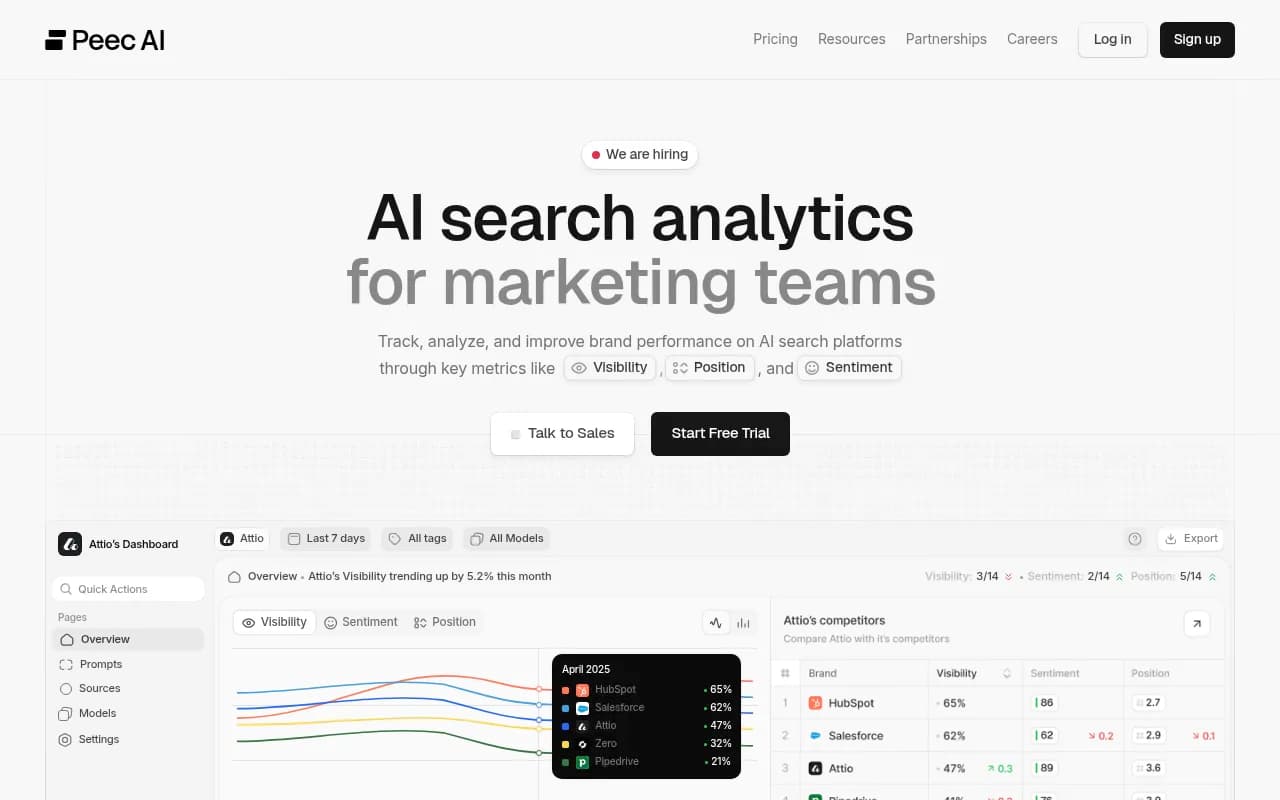
| Peec AI | Community connector | Yes | 6 models | No |
| Profound | API + SDKs | Yes | 9 models | Limited |
| LLM Pulse | Pre-built templates | Limited | 4 models | No |
Promptwatch covers the most models (ChatGPT, Perplexity, Google AI Overviews, Google AI Mode, Claude, Gemini, Meta/Llama, DeepSeek, Grok, Mistral, Copilot) and includes prompt-level data with volume estimates and difficulty scores — which means the prompt-level breakdown section of your report will actually have enough data to be actionable. It also has a Looker Studio integration documented in their platform.
Most of the monitoring-only tools give you enough data to build the summary and trend sections, but fall short on the prompt-level gap analysis that makes section 4 useful.
What to do with the report once it's built
The report itself isn't the goal. The goal is making decisions based on it. A few ways to use it:
- Share it with clients or leadership on a monthly cadence with a written summary of the top 3 changes
- Use the prompt-level gap table to brief your content team on what to write next
- Track the impact of specific content changes by comparing visibility scores before and after publication
- Use model-level differences to prioritize which AI engines to optimize for first (usually the one with the highest traffic share for your category)
If you're using Promptwatch, the platform's built-in AI writing agent can generate content directly from the gap analysis — so you go from "we're invisible for this prompt in Claude" to a published article in the same workflow, without switching tools.
Common mistakes to avoid
A few things that trip people up when building these reports for the first time:
- Tracking too few prompts. If you're only monitoring 10 prompts, the report will look clean but won't tell you much. Aim for at least 50 prompts that represent your actual customer journey.
- Not tagging prompts by funnel stage. A prompt like "what is [category]" is top-of-funnel. "Best [product type] for [use case]" is bottom-of-funnel. Mixing them without segmentation makes trend data hard to interpret.
- Ignoring model-specific behavior. ChatGPT and Perplexity cite sources differently. Gemini often pulls from Google's own properties. Understanding these differences helps you interpret the data correctly rather than treating all models as equivalent.
- Refreshing data too infrequently. AI model responses change. Weekly data is the minimum for a useful trend line; daily is better if you're actively running optimization campaigns.
The multi-model comparison report is one of the most useful things you can build for an AI search strategy right now. It makes the invisible visible — and once you can see where you're missing, you can start fixing it.