Qlik Sense Review 2026
Create interactive dashboards and data visualizations with drag-and-drop interface. Explore data relationships with associative analytics engine.
Key Takeaways:
- Qlik Sense is an on-premises BI platform trusted by 40,000+ customers including Honda, Samsung, Lenovo, and Sephora, built around a proprietary associative analytics engine that enables free-form data exploration without query limitations
- Differentiates from competitors through instant calculations at scale, AI-powered insight generation (Insight Advisor), natural language search, AutoML predictive analytics, and data-driven alerting that monitors all data, not just individual charts
- Best for mid-to-large enterprises and regulated industries needing on-premises deployment, especially those with complex data relationships requiring associative exploration beyond traditional dashboards
- Offers cloud alternative (Qlik Cloud Analytics) with same core capabilities; on-premises pricing requires contacting sales, cloud starts at $2,750/mo for teams
- Limitations include steeper learning curve than modern self-service tools, higher cost than cloud-native competitors, and complexity that may overwhelm small teams seeking simple dashboarding
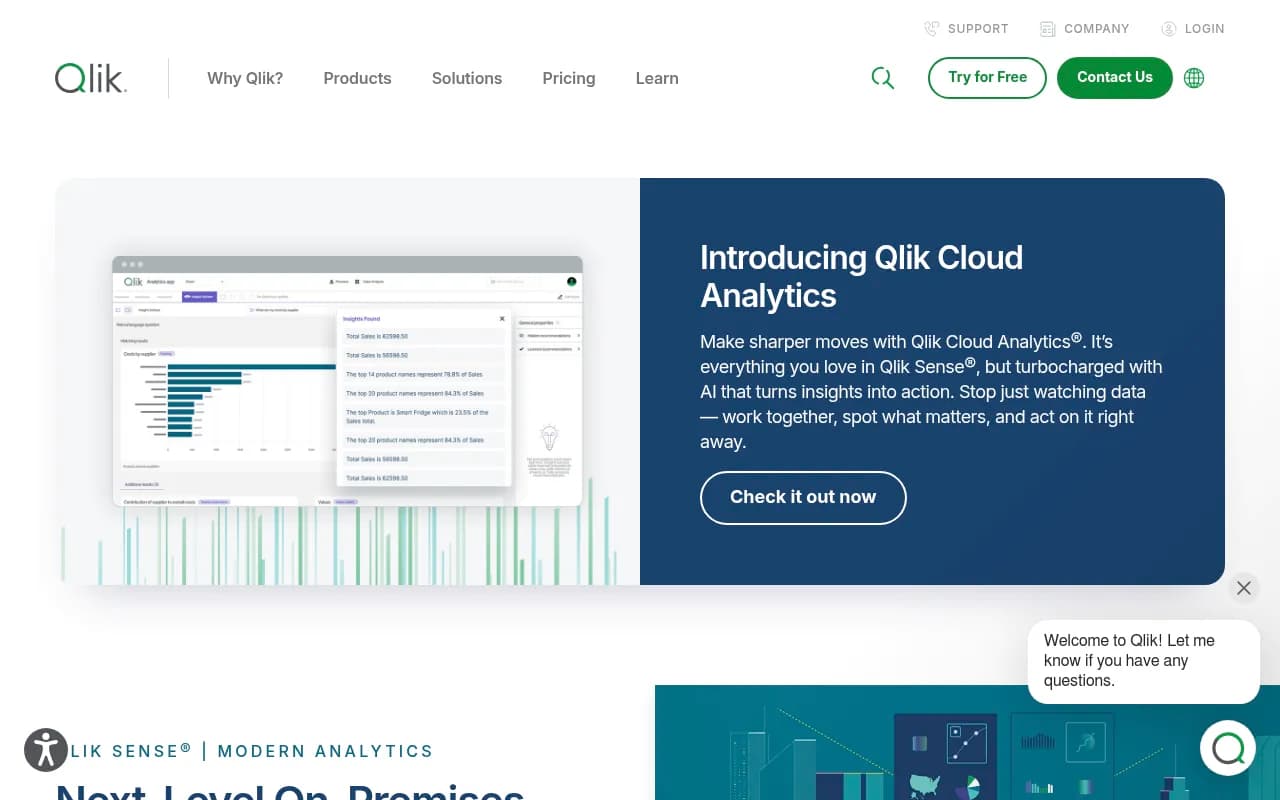
Qlik Sense is an enterprise-grade business intelligence and analytics platform developed by Qlik, a Pennsylvania-based company founded in 1993 (originally as QlikTech). The platform launched in 2014 as Qlik's next-generation product, moving beyond its legacy QlikView tool to offer a more modern, self-service analytics experience. Qlik has been recognized as a Leader in Gartner's Magic Quadrant for Analytics and Business Intelligence Platforms for 15 consecutive years through 2025, competing directly with Tableau, Power BI, Looker, and Thoughtspot.
What sets Qlik Sense apart is its associative analytics engine -- a fundamentally different approach to data analysis compared to query-based tools. Most BI platforms (Tableau, Power BI, Looker) use SQL queries that limit exploration to predefined paths. Qlik's engine loads data into memory and creates associations across all data points, allowing users to click freely in any direction, make selections across any field, and see instant calculations without waiting for queries to run. This means you can explore data relationships that weren't anticipated when the dashboard was built, uncovering hidden patterns competitors' tools would miss.
The platform targets mid-to-large enterprises (500+ employees), particularly in regulated industries like healthcare, finance, manufacturing, and government where on-premises deployment is required. It's also heavily used by data analytics teams supporting business users across departments -- sales ops, finance, supply chain, HR -- who need governed, scalable analytics with complex data integration. Qlik Sense is less suited for small startups or teams wanting quick, simple dashboards; it's built for organizations with serious data complexity and governance requirements.
Associative Analytics Engine (Core Differentiator): The heart of Qlik Sense is its in-memory associative engine. When you load data, Qlik indexes every possible relationship between data points. Users can click any value in any chart, and the entire dashboard instantly recalculates to show related data -- no pre-built drill paths required. Unrelated data is grayed out (not hidden), showing you what's not connected. This "green-white-gray" visual language helps users understand data relationships intuitively. Competitors like Tableau require you to define drill-down hierarchies upfront; Qlik lets you explore freely. The engine handles billions of rows with sub-second response times because calculations happen in RAM, not by querying databases repeatedly.
AI-Powered Insight Advisor: Insight Advisor is Qlik's augmented analytics layer, using machine learning to auto-generate visualizations and surface insights. Type a natural language question ("show me sales by region last quarter") and it builds the chart automatically, selecting appropriate visualization types based on data characteristics. It also runs in the background, analyzing your data to suggest insights you might have missed -- anomalies, trends, correlations. This is more advanced than Power BI's Q&A or Tableau's Ask Data because it's tightly integrated with the associative engine, so suggested insights reflect the full context of your data relationships. The AI also assists with data preparation, auto-detecting data types, suggesting joins, and cleaning messy fields.
AutoML and Predictive Analytics (Qlik Predict): Qlik AutoML (branded as Qlik Predict) lets non-data-scientists build machine learning models directly in Qlik Sense. Upload historical data, select a target variable (e.g. customer churn, sales forecast), and the platform automatically tests multiple algorithms, tunes hyperparameters, and delivers an explainable model with feature importance scores. You can then embed predictions directly into dashboards, so business users interact with ML outputs without knowing they're using machine learning. Competitors like Tableau require separate tools (Tableau Prep, external Python scripts) or integrations with third-party ML platforms. Qlik's approach is more seamless but less flexible than coding custom models in Python.
Data-Driven Alerting and Automation: Qlik's alerting monitors your entire dataset, not individual chart thresholds. Set conditions ("alert me when inventory drops below 100 units for any product in the Northeast region") and Qlik evaluates all data continuously, triggering alerts via email, Slack, or mobile push notifications. This is fundamentally different from Tableau or Power BI, which typically alert on specific metric thresholds in individual dashboards. Qlik also supports event-driven automation -- when an alert fires, it can trigger actions in other systems (create a Jira ticket, update a Salesforce record, send a Slack message) through a low-code workflow builder with pre-built connectors to 100+ cloud apps.
Self-Service Visualization and Dashboards: Qlik Sense offers a drag-and-drop interface for building interactive dashboards. The chart library includes 20+ visualization types (bar, line, scatter, heatmap, treemap, sankey, etc.) plus a marketplace with 100+ custom extensions (network graphs, word clouds, advanced maps). Every chart is fully interactive -- click a bar, and all other charts filter instantly. Dashboards are responsive by default, adapting to desktop, tablet, and mobile screens without separate design work. Compared to Tableau, Qlik's interface is less visually polished but more focused on speed and interactivity. Power BI users will find Qlik's learning curve steeper but appreciate the associative exploration once they adapt.
Data Preparation and Connectivity: Qlik Sense includes built-in ETL (extract, transform, load) capabilities. Connect to 100+ data sources -- SQL databases (Oracle, SQL Server, PostgreSQL, MySQL), cloud data warehouses (Snowflake, Redshift, BigQuery), SaaS apps (Salesforce, Google Analytics, SAP), files (Excel, CSV, JSON), REST APIs, and more. The data manager provides a visual interface for joining tables, creating calculated fields, and transforming data without writing code. For complex transformations, Qlik offers a scripting language (similar to SQL but more flexible) that experienced users can leverage. Qlik also integrates with its separate data integration product (Qlik Talend) for enterprise-scale ETL pipelines.
Embedded Analytics and Custom Development: Qlik Sense provides open APIs (REST, WebSocket, JavaScript) for embedding analytics into custom applications or portals. Developers can white-label dashboards, control user access programmatically, and build custom visualizations using Qlik's extension framework. This makes Qlik popular for OEM use cases -- software vendors embedding analytics into their products. The APIs are more developer-friendly than Tableau's but less modern than Looker's (which is API-first by design). Qlik also supports mashups, where you embed individual charts into web pages while maintaining full interactivity.
Mobile Analytics: Qlik Sense has native iOS and Android apps with full offline support. Download dashboards to your device, explore data without internet, and sync changes when you reconnect. The mobile experience is touch-optimized -- swipe to filter, pinch to zoom, tap to drill down. Mobile alerting delivers push notifications when conditions are met. This is stronger than Tableau's mobile app (which requires constant connectivity) but less polished than Power BI's mobile experience (which has better touch gestures).
Collaboration and Notes: Users can add annotations directly to charts, create discussion threads, and share insights with colleagues. Notes are contextual -- tied to specific data selections -- so when someone views your note, they see the exact data state you were analyzing. This is useful for team decision-making but less robust than dedicated collaboration tools like Mode or Hex, which offer full notebook-style workflows.
Data Catalog and Governance: Qlik Sense includes a data catalog that indexes all datasets, tracks lineage (where data comes from, how it's transformed), and manages access controls. Admins can define security rules at the row or column level, ensuring users only see data they're authorized to access. The catalog also surfaces data quality metrics and usage statistics. This governance layer is critical for enterprises but adds complexity that smaller teams may not need.
Reporting and Distribution: Qlik Sense can generate pixel-perfect reports in PDF, Excel, PowerPoint, and Word formats. Schedule reports to run automatically and distribute via email or shared folders. Reports can be customized per recipient (e.g. each regional manager gets a report filtered to their region). This is more advanced than Tableau's reporting but less flexible than dedicated reporting tools like SSRS or Crystal Reports.
Integrations: Qlik Sense integrates with Google Search Console (for SEO data), Slack (for alerts and collaboration), Zapier (for workflow automation), Salesforce, SAP, Microsoft Teams, Jira, ServiceNow, and 100+ other platforms. The Application Automation module (low-code workflow builder) connects to these systems without custom coding. API access allows developers to build custom integrations.
Who Is Qlik Sense For:
Qlik Sense is best for enterprise analytics teams (5-50 people) supporting business users across a mid-to-large organization (500+ employees). Typical users include BI analysts, data engineers, and business intelligence managers in industries like manufacturing (Honda, Volvo), retail (Sephora, Samsung), healthcare (Merck), finance (HSBC, Lloyd's of London), and logistics. It's particularly strong for organizations with complex data relationships -- supply chain networks, customer journeys across touchpoints, financial consolidations -- where associative exploration uncovers insights traditional dashboards miss.
It's also a fit for regulated industries (healthcare, finance, government) that require on-premises deployment for compliance reasons. Qlik Sense can be installed on your own servers, giving you full control over data security and residency. Competitors like Looker and Tableau are increasingly cloud-only, making Qlik one of the few enterprise-grade options for on-prem deployment.
Who should NOT use Qlik Sense: Small teams (under 50 employees) seeking simple dashboarding will find Qlik overkill. Tools like Metabase, Redash, or even Google Data Studio are faster to set up and easier to learn. Startups prioritizing speed over governance should consider Tableau or Power BI, which have gentler learning curves. Data science teams wanting to write custom Python/R code for analysis will prefer Jupyter, Hex, or Databricks -- Qlik's scripting language is powerful but proprietary. Finally, if you need cutting-edge generative AI features (like AI-generated SQL queries or natural language data storytelling), newer tools like Thoughtspot or Mode are ahead of Qlik.
Pricing:
Qlik Sense on-premises pricing is not publicly listed; you must contact Qlik sales for a quote. Pricing is typically based on named users or concurrent users, with enterprise agreements starting around $50,000-$100,000 annually for mid-sized deployments. For teams preferring cloud deployment, Qlik Cloud Analytics (the SaaS version with the same core capabilities) offers transparent pricing: Starter tier at $2,750/month (50 GB data capacity, 10 users), Standard tier with additional capacity packs, Premium tier with AutoML and advanced features, and Enterprise tier with custom pricing. Annual billing discounts are available. A free trial is offered for Qlik Cloud Analytics.
Compared to competitors: Tableau pricing starts around $70/user/month (cloud) or $35/user/month (on-prem), making it cheaper for small teams but comparable at enterprise scale. Power BI is significantly cheaper at $10-$20/user/month but lacks Qlik's associative engine and on-prem flexibility. Looker pricing is custom but typically higher than Qlik for similar deployments.
Strengths:
- Associative engine is genuinely unique -- no competitor offers this level of free-form exploration without query limitations
- AI-powered insights (Insight Advisor) and AutoML are more integrated than competitors' bolt-on AI features
- Data-driven alerting monitors entire datasets, not just individual charts, catching issues competitors miss
- On-premises deployment option is critical for regulated industries where cloud isn't allowed
- Embedded analytics capabilities are strong, making it a good choice for OEM use cases
- Proven at scale -- 40,000+ customers including Fortune 500 companies demonstrate enterprise readiness
Limitations:
- Steeper learning curve than Tableau or Power BI -- the associative model requires a mental shift, and the interface is less intuitive for beginners
- Higher cost than cloud-native competitors, especially for small teams
- Proprietary scripting language for data prep is powerful but not transferable to other tools (unlike SQL or Python)
- Visualization design is functional but less aesthetically polished than Tableau
- Generative AI features lag behind newer entrants like Thoughtspot (which has more advanced natural language querying)
Bottom Line:
Qlik Sense is the right choice for mid-to-large enterprises that need governed, scalable analytics with complex data relationships and either require on-premises deployment or want the flexibility to choose. The associative engine is a genuine differentiator -- if your users need to explore data freely without predefined paths, Qlik delivers an experience competitors can't match. It's also strong for organizations embedding analytics into custom applications or needing advanced alerting and automation.
However, small teams, startups, or organizations prioritizing ease of use over power should look elsewhere. Tableau and Power BI are faster to learn and cheaper for small deployments. If you're cloud-first and want cutting-edge AI, consider Thoughtspot or Mode.
Best use case in one sentence: Enterprise analytics teams in regulated industries (healthcare, finance, manufacturing) needing on-premises deployment, complex data exploration, and AI-powered insights at scale.
Tags:
Similar and alternative tools to Qlik Sense