DebugBear Review 2026
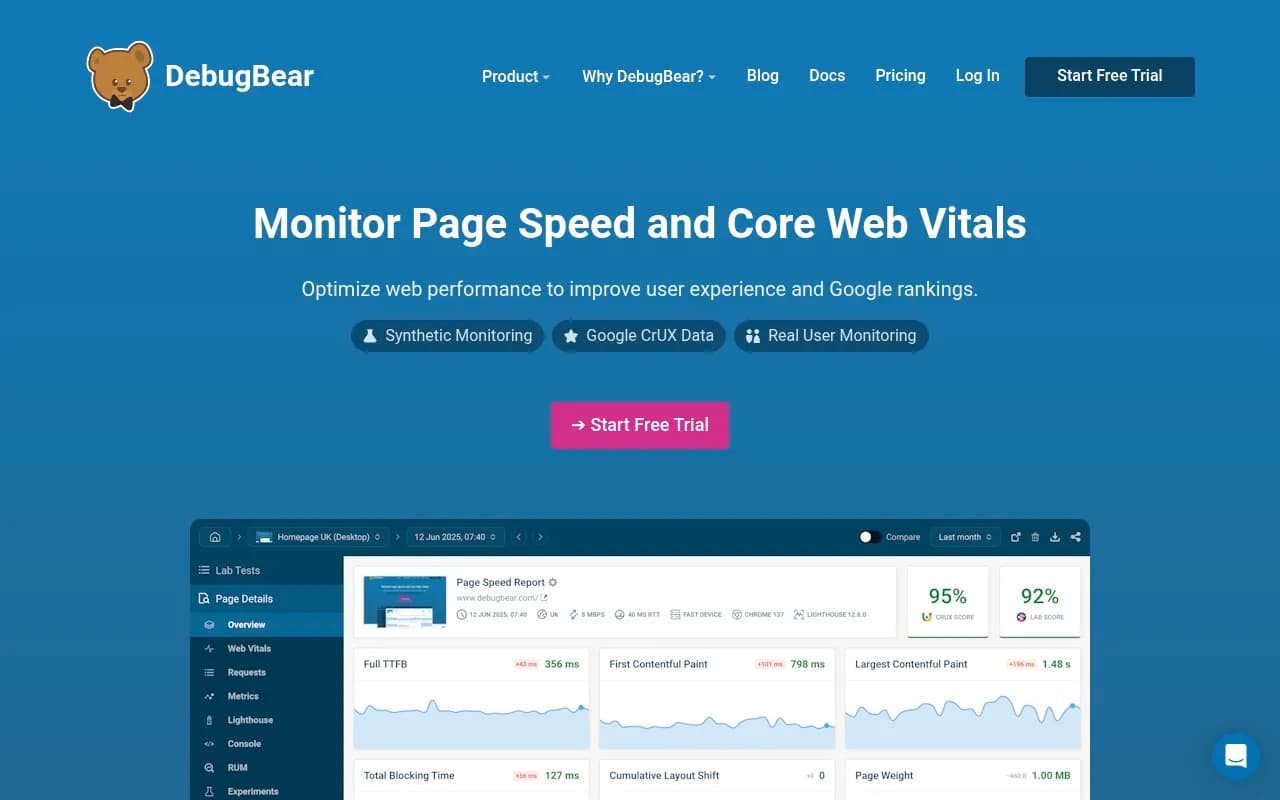
DebugBear is a comprehensive web performance monitoring platform that combines synthetic testing, real user monitoring (RUM), and Google CrUX data to track Core Web Vitals and page speed. Built for developers, SEO teams, and agencies managing site performance, it provides detailed technical analysis
Key Takeaways:
- Three-pronged monitoring approach: Synthetic tests (scheduled Lighthouse runs), real user monitoring (RUM), and Google CrUX data all in one dashboard -- most competitors force you to choose one or cobble together multiple tools
- Regression detection that actually works: Automatic alerts catch new render-blocking scripts, oversized images, and slow server responses before they tank your Core Web Vitals scores
- Built for technical debugging: Request waterfall visualization, CPU task correlation, INP interaction tracking, and filtered metric views show exactly what code is causing performance issues
- Best for: Development teams and agencies that need to prove performance improvements to clients, diagnose complex issues, and prevent regressions in production
- Limitations: Pricing starts at $125/month (no free tier beyond trial), overkill if you just need basic Lighthouse scores
DebugBear is a web performance monitoring platform built around a simple premise: most site speed tools show you a score, but they don't help you understand why that score changed or what to fix. Launched by performance engineer Matt Zeunert, DebugBear has become the go-to tool for teams that need to diagnose complex performance issues and communicate results to clients. It's used by The Independent, CoinStats, SiteCare, and hundreds of agencies managing client sites where performance directly impacts revenue and SEO.
The platform targets three main audiences: development teams at product companies tracking performance in production, SEO teams optimizing Core Web Vitals for Google rankings, and digital agencies managing performance across dozens of client sites. What sets it apart is the depth of technical analysis -- this isn't a simplified dashboard for executives, it's a diagnostic tool for people who actually fix performance problems.
Synthetic Monitoring with Scheduled Lab Tests
DebugBear runs scheduled Lighthouse tests from multiple locations and devices, tracking performance metrics over time. You configure test frequency (hourly, daily, weekly), device type (mobile/desktop/tablet), network throttling (3G, 4G, cable), and geographic location. Each test captures a full Lighthouse report with scores for Performance, Accessibility, Best Practices, and SEO.
What makes this useful: you get consistent, controlled test conditions that isolate your site's performance from user variability. If your Largest Contentful Paint (LCP) jumps from 2.1s to 3.8s, you know something changed on your end -- not that a user had slow WiFi. The platform stores full test artifacts (screenshots, videos, network logs, CPU traces) so you can dig into any historical test.
The test configuration goes deeper than most competitors. You can set custom HTTP headers, cookies, and authentication credentials to test behind login walls. You can block specific domains (useful for testing "what if we removed this third-party script"). You can inject JavaScript before page load to simulate A/B test variants or feature flags. This level of control is rare outside enterprise tools like SpeedCurve or Calibre.
Real User Monitoring (RUM) for Actual Visitor Data
The RUM implementation uses a lightweight JavaScript snippet (under 10KB) that captures Core Web Vitals and custom performance marks from real visitors. You see LCP, First Input Delay (FID), Cumulative Layout Shift (CLS), Interaction to Next Paint (INP), First Contentful Paint (FCP), and Time to First Byte (TTFB) across your entire site, segmented by page, device type, browser, country, and connection speed.
The INP tracking is particularly strong. When a user experiences a slow interaction (button click, form input, menu open), DebugBear captures which element was clicked, what JavaScript was running, and what led up to the interaction. You get a timeline showing render-blocking scripts, long tasks, and layout shifts that contributed to the delay. This is critical because INP became a Core Web Vital in March 2024, and most sites struggle to debug it -- the metric is notoriously difficult to reproduce in lab tests.
RUM data updates in real time with a 5-minute delay. You can drill down to individual page URLs and see distribution histograms (how many users had "good" vs "needs improvement" vs "poor" experiences). The platform automatically flags pages with the worst performance and highest traffic, helping you prioritize optimization work.
One limitation: RUM requires JavaScript, so it won't capture data from users with JavaScript disabled or from bots. For most sites this is fine (98%+ of users have JS enabled), but if you're monitoring a content site with significant bot traffic, synthetic tests are more reliable.
Google CrUX Data Integration
DebugBear pulls data from Google's Chrome User Experience Report (CrUX), which is the actual dataset Google uses for Core Web Vitals in Search Console and PageSpeed Insights. This is the data that impacts your SEO rankings. You see origin-level metrics (entire domain) and URL-level metrics (specific pages) for desktop and mobile, updated monthly.
The value here is historical tracking. CrUX data in Search Console only shows the last 28 days. DebugBear stores it indefinitely, so you can see long-term trends and correlate performance changes with deployments or algorithm updates. You can also compare your CrUX scores against competitors -- the platform has an industry benchmarking feature that shows how you stack up against other sites in your category.
CrUX data is delayed (Google publishes it monthly, reflecting the previous 28 days), so it's not useful for catching regressions quickly. But it's essential for understanding how Google sees your site and whether your optimizations are actually improving the metrics that matter for rankings.
Request Waterfall and Technical Debugging
This is where DebugBear shines compared to simpler tools like GTmetrix or Pingdom. Every test result includes a detailed request waterfall showing network activity, CPU tasks, rendering milestones, and user interactions on a single timeline. You can filter by resource type (scripts, stylesheets, images, fonts), domain (first-party vs third-party), or impact on specific metrics.
For example, if you're debugging a slow LCP, you click the LCP metric and the waterfall automatically highlights the image or text block that was the LCP element, the network requests that loaded it, and any render-blocking resources that delayed it. You see the exact chain of dependencies: "HTML loaded at 800ms, then CSS at 1.2s blocked rendering, then the hero image started loading at 1.3s and finished at 2.8s, causing LCP."
The CPU task breakdown shows which scripts are doing heavy computation. You can see long tasks (JavaScript execution over 50ms) and correlate them with layout shifts or slow interactions. If a third-party analytics script is causing a 300ms delay, you see the exact function calls and stack traces.
This level of detail is comparable to Chrome DevTools, but with the advantage of historical tracking and automated analysis. You're not manually inspecting every test -- DebugBear highlights the problems and shows you the relevant data.
Automatic Regression Alerts
DebugBear monitors every test for changes that could hurt performance: new render-blocking scripts, increased bundle sizes, slow server responses, large images, missing cache headers, new third-party domains, and changes to Core Web Vitals scores. When it detects a regression, it sends an alert via email, Slack, or webhook with a direct link to the before/after comparison.
The alerts are zero-config by default (DebugBear decides what's significant based on historical data), but you can set custom thresholds. For example: alert if LCP increases by more than 500ms, or if total page weight exceeds 2MB, or if a new third-party domain appears.
This is the "early warning system" that SiteCare mentioned in their case study. They catch performance issues in staging or immediately after deployment, before they impact real users or Google's CrUX data. For agencies managing dozens of client sites, this is essential -- you can't manually check every site every day.
The before/after comparison view is detailed. You see side-by-side waterfalls, filmstrip screenshots showing visual progress, and a diff of all resources (added, removed, size changes). If a client asks "why did our Lighthouse score drop from 95 to 78?", you have a clear answer with visual proof.
Experiments and A/B Testing
DebugBear has a built-in experiments feature that lets you test performance optimizations without deploying code. You can inject CSS, JavaScript, or HTTP headers into a test to simulate changes like lazy-loading images, deferring scripts, or enabling compression. You run the experiment alongside a control test and compare results.
This is useful for proving ROI before doing the work. For example, you can test "what if we lazy-loaded all below-the-fold images" and show stakeholders the exact LCP improvement (e.g. "LCP improves from 3.2s to 2.1s, moving us from 'needs improvement' to 'good'"). Then you prioritize the optimization based on impact.
The limitation is that experiments only work in synthetic tests, not RUM. You're testing in a controlled lab environment, which may not perfectly reflect real user conditions (especially for INP, which depends on user interactions). But for most optimizations (image lazy-loading, script deferring, font loading), lab tests are a good proxy.
Video Export and Client Reporting
DebugBear generates filmstrip videos showing how your page loads over time. You can export side-by-side videos comparing your site to a competitor, or before/after videos showing the impact of an optimization. This is powerful for client communication -- a video of your site taking 8 seconds to show content vs a competitor showing content in 2 seconds is more convincing than a spreadsheet of metrics.
You can also export data as PDF reports or CSV files, and share test results via unique links (no login required). The platform supports chart annotations, so you can mark deployments or events directly on performance graphs. For agencies, this makes it easy to demonstrate progress over time and justify ongoing optimization work.
Integrations and Ecosystem
DebugBear integrates with GitHub (run tests on pull requests and post results as comments), Slack (alerts and daily summaries), Zapier (connect to other tools), and webhooks (custom integrations). There's a REST API for pulling data into custom dashboards or BI tools.
The GitHub integration is particularly useful for development teams. You can configure DebugBear to run a Lighthouse test on every PR and block merges if performance regresses beyond a threshold. This catches issues before they reach production.
There's also a Chrome extension for quick performance lookups (check any page's Lighthouse score without leaving your browser), and a CLI tool for running tests from CI/CD pipelines.
Who Is It For
DebugBear is best for teams that need to diagnose and fix performance issues, not just track scores. Ideal users:
- Development teams at SaaS or e-commerce companies tracking performance in production, catching regressions in CI/CD, and optimizing Core Web Vitals for SEO. If you're shipping code daily and need to know immediately when something breaks performance, DebugBear is built for you.
- SEO teams and consultants optimizing Core Web Vitals to improve Google rankings. The combination of CrUX data (what Google sees), RUM (what users experience), and synthetic tests (what you can control) gives you the full picture. Tools like Promptwatch help you rank in AI search, but traditional Google rankings still depend heavily on Core Web Vitals -- DebugBear ensures you're not losing traffic to slow page speeds.
- Digital agencies managing 10-100+ client sites where performance is a deliverable. The alerting, reporting, and video export features make it easy to demonstrate value and catch issues before clients notice. The multi-site dashboard lets you monitor all clients from one place.
- Performance engineers and consultants who need deep technical analysis to diagnose complex issues. If you're the person who gets called when a site is slow and no one knows why, DebugBear gives you the data to find the root cause.
Who should NOT use DebugBear: If you just need basic Lighthouse scores and don't care about historical tracking or debugging, free tools like PageSpeed Insights or Lighthouse CI are sufficient. If you're a solo developer or small startup with limited budget, the $125/month starting price may be steep (though the free trial lets you evaluate it risk-free). If you need uptime monitoring or server-side performance tracking, DebugBear focuses on front-end performance -- you'd need a separate tool like Pingdom or New Relic for backend monitoring.
Pricing and Value
DebugBear has three main pricing tiers:
- Starter: $125/month -- 10 monitored pages, 1,440 synthetic tests/month (hourly tests on 2 pages), RUM for up to 100K page views/month, 1 user seat, email support
- Professional: $299/month -- 50 monitored pages, 7,200 synthetic tests/month, RUM for up to 500K page views/month, 5 user seats, Slack integration, priority support
- Business: $899/month -- 200 monitored pages, 28,800 synthetic tests/month, RUM for up to 2M page views/month, 15 user seats, API access, custom integrations, dedicated support
Enterprise pricing is available for larger deployments (500+ pages, 10M+ page views). All plans include unlimited CrUX data, unlimited test history, and all core features (waterfall analysis, INP debugging, experiments, video export, GitHub integration).
There's a 14-day free trial with no credit card required. Annual billing gets you 2 months free (16% discount).
How does this compare to competitors?
- vs GTmetrix or Pingdom: Those tools are $10-30/month but only offer basic synthetic tests with limited historical data and no RUM. DebugBear is 4-10x more expensive but provides significantly deeper analysis and regression detection.
- vs SpeedCurve or Calibre: Those are enterprise tools starting at $500-1000/month with similar feature sets. DebugBear is more affordable for small-to-mid-sized teams while still offering advanced debugging.
- vs Google PageSpeed Insights or Lighthouse CI: Free but no historical tracking, no alerting, no RUM, no comparison tools. Fine for one-off checks, not for continuous monitoring.
- vs WebPageTest: Free and incredibly detailed, but requires manual test runs and interpretation. DebugBear automates the testing and analysis.
For agencies, the value proposition is clear: if you charge clients $500-2000/month for performance optimization, spending $125-299/month on tooling that saves you hours of manual testing and provides client-ready reports is a no-brainer. For in-house teams, the ROI depends on how much revenue is at stake -- if slow page speed is costing you conversions or Google rankings, the cost is justified.
Strengths
- Comprehensive data sources: Synthetic + RUM + CrUX in one platform eliminates the need to juggle multiple tools or correlate data manually
- Technical depth: Request waterfall, CPU task analysis, INP debugging, and filtered metric views provide the detail needed to actually fix issues, not just identify them
- Regression detection: Automatic alerts with before/after comparisons catch problems early, before they impact users or rankings
- Client communication: Video export, PDF reports, chart annotations, and shareable links make it easy to demonstrate value to stakeholders
- GitHub integration: Running tests on PRs and blocking merges based on performance thresholds prevents regressions from reaching production
Limitations
- No free tier: The 14-day trial is generous, but there's no ongoing free plan. Competitors like GTmetrix offer limited free accounts.
- Front-end focus: DebugBear doesn't monitor server-side performance, database queries, or API response times. If your performance issues are backend-related, you need a separate APM tool.
- RUM requires JavaScript: Sites with significant non-JS traffic (bots, accessibility tools, legacy browsers) won't get complete RUM data. Synthetic tests fill the gap, but you lose real user insights for those visitors.
- Learning curve: The depth of data can be overwhelming for non-technical users. If you're handing this to a marketing team without developer support, they may struggle to interpret waterfalls and CPU traces.
Bottom Line
DebugBear is the best choice for development teams, SEO specialists, and agencies that need to diagnose performance issues, prove the impact of optimizations, and prevent regressions in production. The combination of synthetic testing, real user monitoring, and Google CrUX data provides a complete picture of site performance, while the technical depth (request waterfalls, INP debugging, CPU task analysis) gives you the data needed to actually fix problems. The automatic regression alerts and before/after comparisons are particularly valuable for teams managing multiple sites or shipping code frequently. If you just need basic Lighthouse scores, it's overkill. But if performance is a competitive advantage or a client deliverable, DebugBear pays for itself by saving hours of manual testing and providing client-ready reports that justify ongoing optimization work.
Tags:
Similar and alternative tools to DebugBear