Key takeaways
- Median Google Ads CPC sits at $5.42 (US search, 2026), but that blended number hides huge variance by vertical, from $1.63 in arts and entertainment to $9.87 for legal.
- ChatGPT didn't show ads at all until May 27, 2026. By mid-August it was running in roughly a third of web-search responses, and ads are concentrated on the same broad, non-branded prompts that organic AI citations target.
- You don't need top-tier domain authority to get cited. In August 2026, domains ranked DR 46-75 captured nearly half of all ChatGPT citation share, while the very top tier (DR 91-100) actually got cited less often than low-authority sites.
- Only 14% of enterprise marketing teams currently track AI/LLM citation visibility at all, according to a Goodfirms survey cited by Siteimprove, so most benchmarking comparisons right now are a guess, not a model.
- The honest way to compare ad spend to organic AI visibility is cost-per-citation-click versus cost-per-paid-click, measured over the same 90-day window, not a one-time snapshot.
Why this comparison matters now
For fifteen years marketers have had one real yardstick for "is this working": cost per click, cost per lead, ROAS. AI search breaks that yardstick because there isn't a bid, there isn't an auction, and there isn't a line item on an invoice. Your brand either gets cited in a ChatGPT answer or it doesn't, and nobody charges you for the privilege.
That's exactly why it's tempting to treat AI visibility as free money and under-invest in measuring it. I think that's a mistake, and the data backs it up. Zero-click behavior on Google has accelerated faster than almost anyone predicted. Similarweb's clickstream panel found 68.01% of Google searches ended without a click in the first four months of 2026, up from 60.45% just two years earlier. When Google shows an AI Overview, click-through drops from roughly 15% to 8%, according to Pew Research Center's tracking of nearly 69,000 real searches. People are still searching. They're just not clicking the way they used to, and a chunk of that attention is landing in AI answers instead of your ad.
So the real question for 2026 budgets isn't "should we spend on ads or on AI visibility." It's "what is each dollar actually buying us, and how do we compare the two on the same scale."
Start with what ad spend actually costs you
Before comparing anything, get your paid baseline right, because a lot of circulating CPC benchmarks are stale. The old "$2.96 average CPC, 3.52% CTR" figure that still gets repeated in blog posts traces back to a pre-2018 WordStream report. The real 2026 numbers are different: median Google Ads CPC across industries sits at $5.42 (up from $5.26 a year prior), median CTR is 6.64%, and median conversion rate is 8.18%, per WordStream/LocaliQ's 2026 benchmark report.
That blended average hides a wide range. Legal services average $9.87 per click, up 15% year over year. Home improvement sits at $8.33, dentists at $8.00. On the other end, arts and entertainment averages $1.63 and travel $2.14. If you're in a high-CPC vertical, every dollar you divert from paid search to organic AI visibility has outsized leverage. If you're already in a cheap vertical, the math is less dramatic but the attention shift is still real.
One more wrinkle: Databox's live benchmark across 4,700+ companies puts the median CPC at just $1.53 as of July 2026, far below the $5.42 blended mean. That gap exists because a handful of expensive verticals pull the average up. Don't benchmark against the industry-wide number. Pull your own account's trailing 90-day CPC and CPA and use that as your actual baseline.
Then map the AI visibility side of the ledger
This is where most teams get stuck, because AI citations don't come with a cost attached. You have to build the equivalent of a cost basis yourself. Three numbers matter.
Citation competition in your category
Not every AI answer is equally crowded. Promptwatch's citation data from late September 2026 found that 47.6% of ChatGPT web-search responses now cite 10 or more unique domains, and 66.1% cite at least 8. But that varies enormously by prompt type. Organic, non-branded prompts are the most crowded (52.5% cite 10+ domains). Brand-specific prompts are far less crowded, only 21.3% cite 10+ domains, and 5 domains is the single most common count. Competitor-comparison prompts sit close to organic prompts in crowding.
That matters for benchmarking because it tells you where your odds are actually decent. If you're trying to win a broad "best project management software" style prompt, you're competing against 10+ other domains in most answers. If you're trying to win citations on prompts that name your brand or compare you directly to a named competitor, the field is thinner and a single good page can move your visibility meaningfully faster.
Domain authority isn't the gatekeeper you think it is
A common objection to investing in organic AI visibility is "we don't have the domain authority to compete." Promptwatch's August 2026 data on ChatGPT citation share by domain rank argues against that. Domains in the DR 46-60 and DR 61-75 buckets together captured roughly 46% of all citation share, the largest block by far. Meanwhile the very top tier, DR 91-100, collapsed from about 7% of citations in week one of the month to roughly 3% by August 14 and stayed there, lower than DR 0-15 domains at 6.3%. Mid-authority sites with the right content are winning citations that pure domain strength used to guarantee on Google.
Ads are now competing for the exact same real estate
This is the part that should change how you think about the comparison. ChatGPT showed zero ads until May 27, 2026, when they appeared in just 1.69% of responses. By July 1 that had crossed 30%, and the most recent 7-day average Promptwatch tracked was 32.4%, up 12.5% week over week. You can check the current trend yourself in Promptwatch's ChatGPT ads over time report.
Here's the kicker: of ad-bearing ChatGPT responses, 73.3% appear on organic, non-branded prompts, the same prompt category where organic citations are most contested. Advertisers aren't buying brand-defense placements, they're bidding on the broad discovery queries that AI visibility work also targets. If you're budgeting for both channels, you're increasingly budgeting for the same slice of attention, just through two different mechanisms.
Building the actual comparison
With those three pieces in place, here's a framework that holds up to scrutiny rather than a vague "AI is the future" argument.
Step 1: Establish your paid cost per acquisition. Pull trailing 90-day data: ad spend, clicks, conversions, CPA. Don't use industry averages, use your account.
Step 2: Instrument AI referral traffic properly. ChatGPT automatically appends utm_source=chatgpt.com to many outbound links, but Gemini and Perplexity generally don't add UTM parameters yet. If your GA4 setup only looks for UTM tags, you'll misclassify a chunk of this traffic as "Unassigned" or even "Direct," since logged-out ChatGPT users often don't send referrer data at all. Build a custom channel group with an OR condition catching utm_source=chatgpt.com plus known AI referrer domains. Reported 2026 ranking by referral volume: ChatGPT first, Gemini overtaking Perplexity for second place as of April 2026, then Claude.
Step 3: Track citation volume and share of voice separately from traffic. Traffic tells you what converted. Citation share tells you how often you're even in the conversation, which is the leading indicator. If your citation share is climbing but traffic hasn't caught up yet, that's expected lag, not failure. If citation share is flat, no amount of patience will fix it.
Step 4: Calculate cost per AI-driven conversion against your paid CPA. Add up what you actually spent to earn those citations, content production, technical optimization, any tooling, and divide by AI-attributed conversions. Compare that to your paid CPA from step 1, over the same quarter.
| Metric | Paid search | Organic AI visibility |
|---|---|---|
| Median unit cost | $5.42 CPC (blended, 2026) | No per-click cost, but content/tooling investment |
| Dominant content type | Ad copy + landing page | Cited pages: product pages lead ChatGPT citations at roughly a third of the total in July 2026 |
| Competitive crowding | Auction-based, scales with bid | 47.6% of ChatGPT responses cite 10+ domains on organic prompts; narrower on brand prompts |
| Entry barrier | Budget | Mid-authority domains (DR 46-75) capture ~46% of citation share, no premium required |
| Measurement maturity | Decades of attribution tooling | Only 14% of enterprise teams currently track it |
| Trend direction | CPCs up ~3% YoY | ChatGPT ad presence up from 0% to ~32% of responses in under 3 months, eating into the same prompt real estate |
Where the comparison gets genuinely interesting
The UV Blocker case study cited by Cintra is a useful real-world data point: 38,000 organic clicks and doubled weekly orders came from AI visibility investment without increasing ad spend. A separate SaaS case, Hamming.ai, reportedly saw 8.5x organic traffic growth through the same organic-first approach. These aren't universal guarantees, every category behaves differently, but they're a reasonable counter to the assumption that AI visibility is too slow or too soft to matter financially.
The content type that wins also matters for your budget decision. ChatGPT's July 2026 citation mix shows product pages leading at roughly a third of all citations, with listicles the fastest-growing format. If you're an ecommerce or SaaS brand with strong, well-structured product pages already, you may be closer to meaningful organic AI visibility than your ad budget conversations assume.
Tools for actually running this benchmark
You can't benchmark what you don't measure, and spreadsheets only get you so far once you're tracking citations across five or six AI engines plus paid channels. A handful of platforms are built specifically to close this gap.
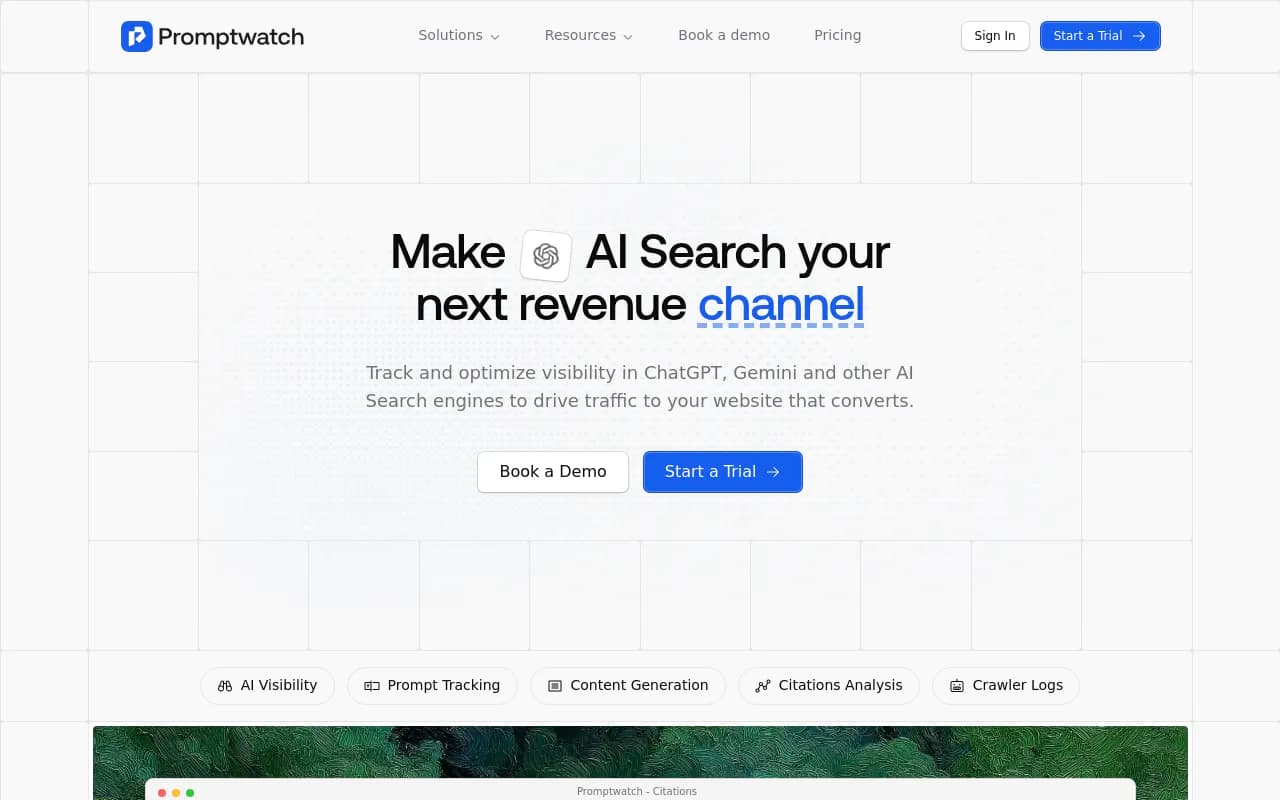
Promptwatch tracks prompt volumes, difficulty, and citation rates across ChatGPT, Gemini, Claude, Perplexity, Google AI Overviews, AI Mode and more, and pairs that with real visitor analytics showing which AI-driven traffic actually converts, not just which prompts mention you. It also logs AI crawler activity (ChatGPTBot, ClaudeBot, PerplexityBot, and 400+ others) so you can see the mechanical link between crawl and citation, something a paid-search dashboard has no equivalent for.
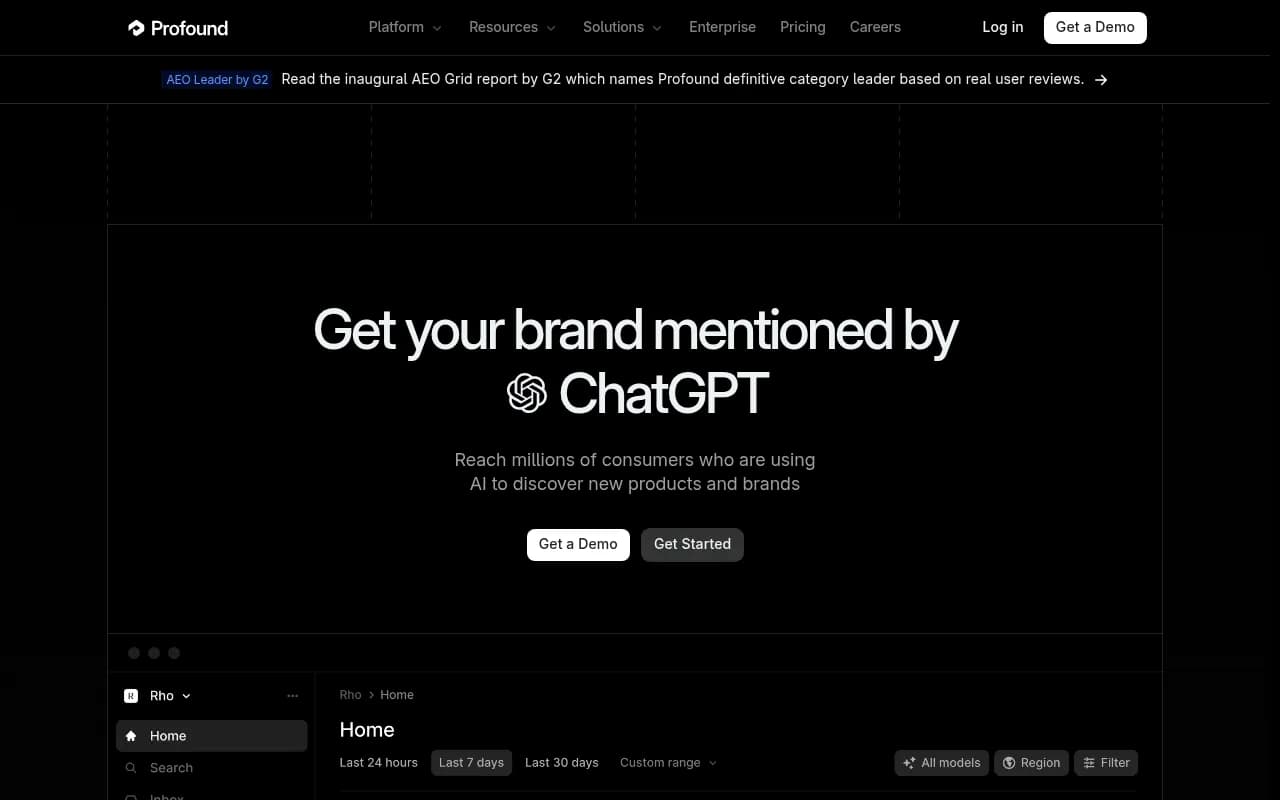
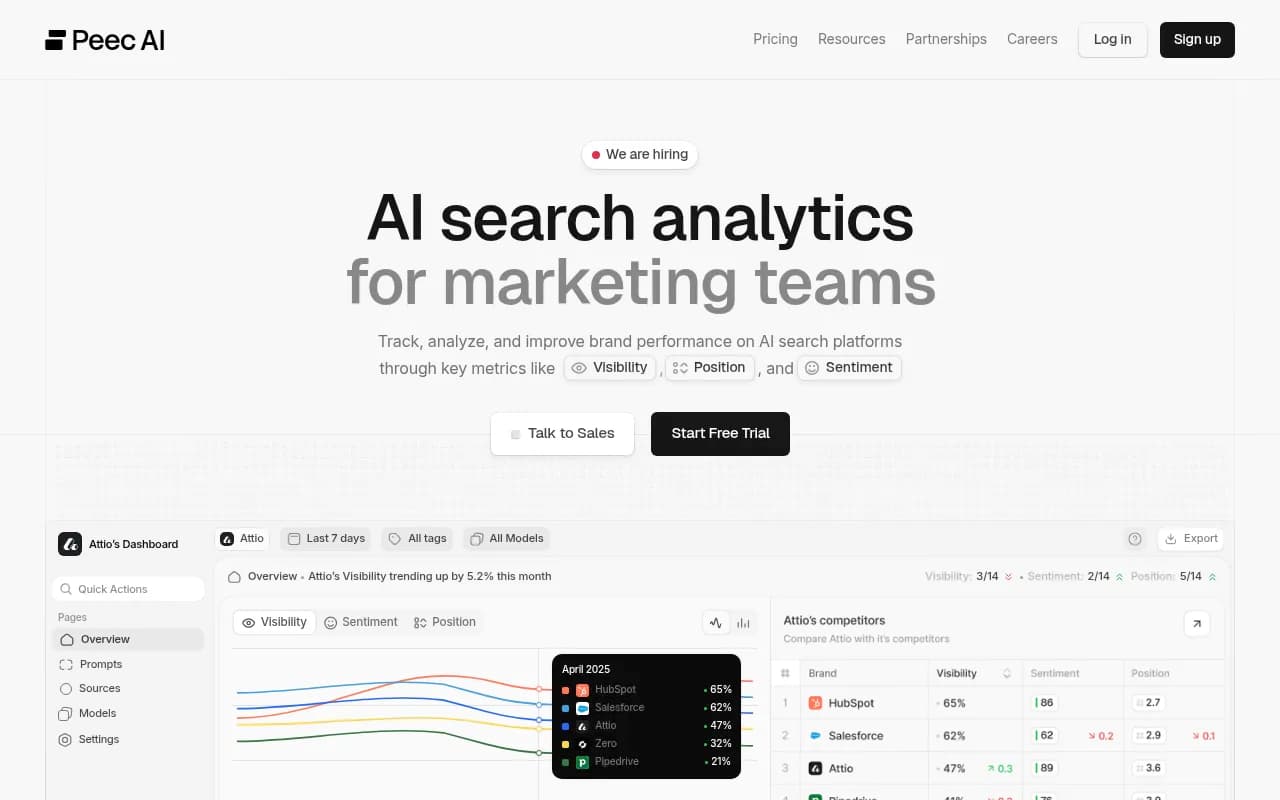
If you want a lighter-weight starting point before committing budget, Profound and Peec AI both offer entry tiers around $95-99/month that track citation presence across a handful of engines, useful for a first-pass comparison before scaling the benchmarking effort.
Profound
For the paid side of the ledger, most teams already have Google Ads reporting, but pairing it with a cross-channel attribution tool like Ruler Analytics or Hyros makes the CPA comparison in step 4 far less manual.
If you want a wider view of what's available in this space before picking a tool, the GEO software directory at bestgeosoftware.com has a broader comparison across platforms, and the AI rank tracker listings at ai-rank-tools.com are worth a look if you need something narrower and cheaper to start.
A few things to watch out for
Don't let a clean-looking chart fool you into overconfidence. Several zero-click and AI-citation statistics circulating in 2026 mix incompatible methodologies and date ranges, enough that one detailed correction piece from digitalapplied.com explicitly withdrew previously published zero-click comparisons as unsupported. When you see a dramatic year-over-year AI traffic stat, check whether it's comparing the same panel and the same definition of a "click."
Also expect the ad side of this comparison to keep moving. ChatGPT's ad presence nearly doubled in a single month between June and July 2026. Whatever ratio you calculate today between paid CPC and organic citation cost will need revisiting quarterly, not annually. Treat this benchmark as a living dashboard, not a one-time report you hand to finance and forget about.
The honest conclusion isn't "kill your ad budget and go all-in on AI visibility." It's that most teams are currently running one side of this comparison blind. Fix that first, then let the numbers argue for themselves.