Key takeaways
- Executives read one page. Put a headline, three or four KPIs and a short what happened / what it means / what we do next story on it, and push everything else into an appendix.
- Write the headline as a finding, not a title: "AI visibility improved, but competitors lead in two priority topics."
- Every number needs a denominator and a methods box (prompts, engines, dates, locations). Without it, nobody can trust month-over-month changes.
- Annotate platform-side shifts. If ChatGPT changes how it cites sources, your score moves for reasons that have nothing to do with your PR work.
- For PR specifically, track third-party citations (reviews, listicles, editorial), not just your own pages. Press releases are a small slice of what AI cites for branded prompts.
Why most AI visibility reports get ignored
I have seen the typical version. Forty screenshots, a dozen charts, a score nobody can define, and a closing paragraph that says "we will continue to monitor." The CMO skims page one, sees no decision attached to it, and closes the file.
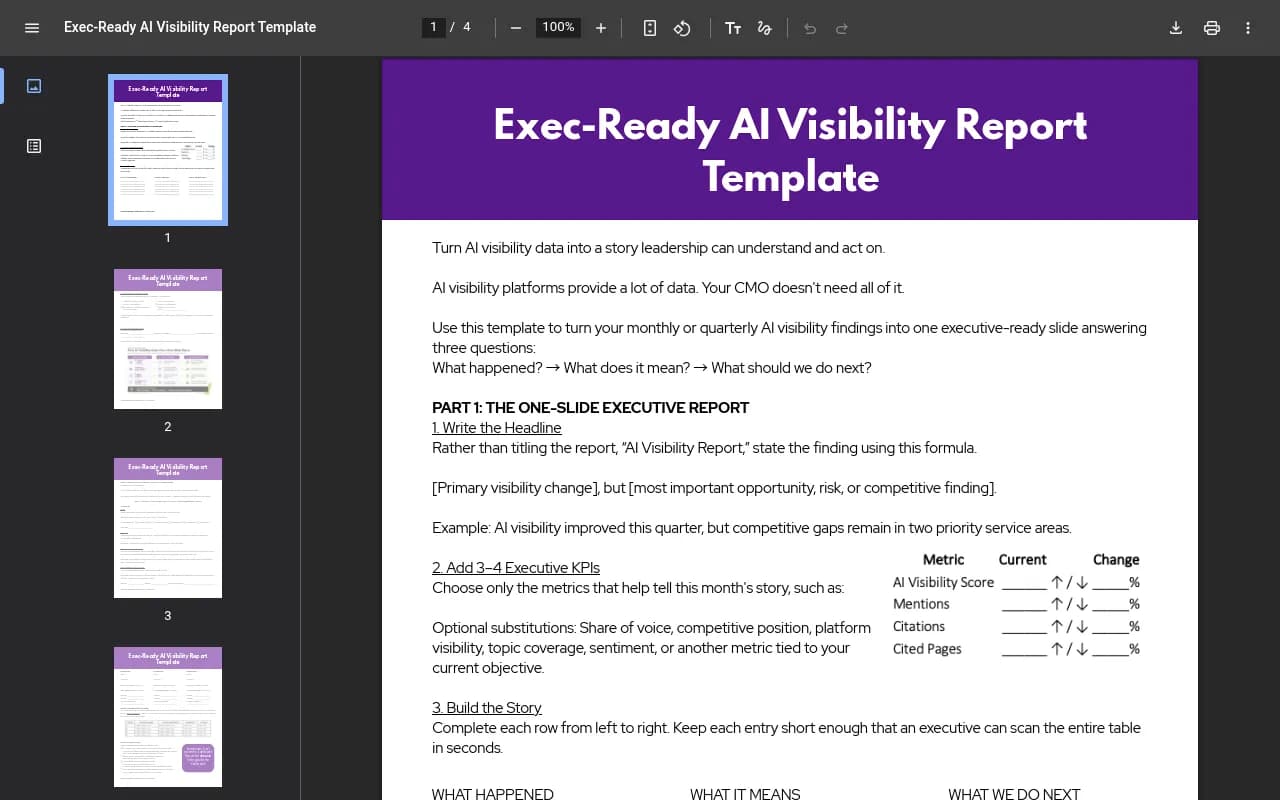
AI visibility platforms produce a lot of data. Your executive does not need most of it. The Penheel one-slide template puts the whole job in three questions: what happened, what does it mean, and what should we do next. Everything else in this guide is a way of answering those three questions honestly and quickly.
PR teams have a particular advantage here. You already know how to write a briefing for people who have 90 seconds. You also already think in terms of earned coverage, third-party credibility and narrative. AI answers are built largely from exactly that material, which makes this a report PR should own rather than hand off to SEO.
The structure of the report
The format that holds up has two layers. A single executive page that anyone can read standing in a hallway, and a short working appendix that proves the page isn't made up.
| Section | Audience | Length | Purpose |
|---|---|---|---|
| Executive page | CMO, comms lead, CEO | 1 page or slide | Headline, 3-4 KPIs, one visual, one recommendation |
| Methods box | Anyone who questions the numbers | 5-6 lines | Prompts, engines, locations, dates, run counts |
| Evidence table | PR team, SEO team | 1-2 pages | Prompt-by-engine results with raw answers |
| Factual accuracy log | Comms, legal, product | Half a page | What AI says that is wrong, and the fix |
| Actions and owners | Whole team | Half a page | What happens next month, and who does it |
Write the headline last
Cognizo's guidance is to write the first section last, once the rest of the report has told you what the story is. I agree. If you write the summary first you will force the data into a narrative you guessed at.
Then use the Penheel headline formula: [primary visibility change], but [most important opportunity, risk or competitive finding]. A few examples:
- "AI visibility is up 7 points, but a competitor now leads us in enterprise comparison prompts."
- "We are mentioned more often in ChatGPT, but it still quotes our old pricing."
- "Visibility is flat, and the cause is a platform change, not our coverage."
That third one matters. A flat month with a clear explanation is a good report.
Pick three or four KPIs, not twelve
The Penheel template suggests a visibility score, mentions, citations and cited pages, with share of voice, sentiment, topic coverage or platform visibility as substitutions. Choose the ones that tell this month's story. A launch month might lead with share of voice. A crisis month leads with sentiment.
Whatever you pick, define it on the page. Promptwatch's academy has plain definitions you can borrow: Visibility Score and Share of Voice are the two most common headline metrics, and the citations vs mentions page is worth reading before you put both in one table, because they measure different things.
| KPI | What it answers | Watch out for |
|---|---|---|
| Visibility score | How prominently are we in answers overall? | Composite scores hide which engine moved |
| Share of voice | What slice of brand mentions is ours? | Depends on which competitors you track |
| Citations / cited pages | Are AI engines using our content or third-party content about us? | Counting method: one page cited in many responses counts many times |
| Sentiment | How are we described? | Read with visibility, since they move independently |
| Position | Where do we land in the list of brands? | Lower is better, which confuses readers |
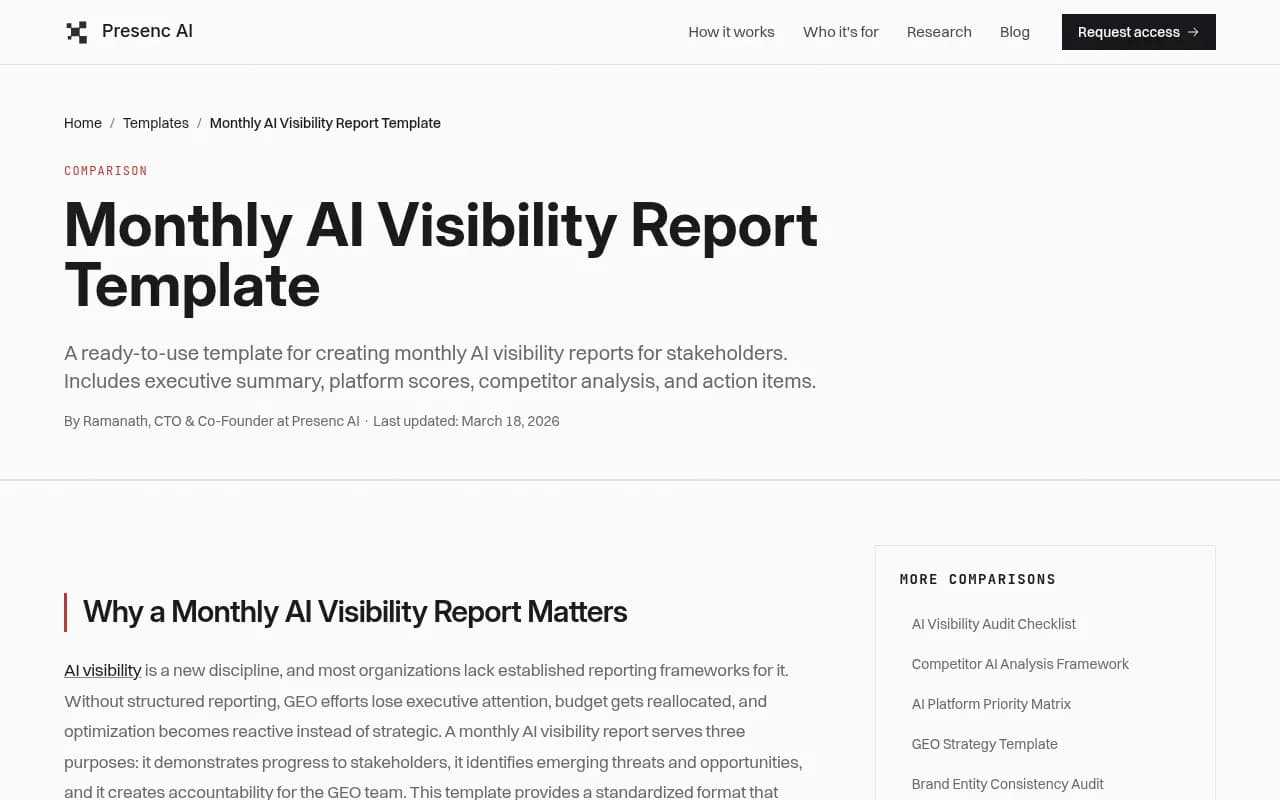
The Presenc AI template takes a similar approach: one headline metric with a month-over-month change, three wins, two concerns and one recommendation. Its tip about specificity is the best one in the document. "Brand now appears in 8 of 10 category prompts on Perplexity (up from 5)" beats "Perplexity visibility improved" every time.
Fill in the what happened / what it means / what we do next table
This is the core of the page. One row per finding, three columns, short enough to scan in seconds.
| What happened | What it means | What we do next |
|---|---|---|
| Mentioned in 8 of 10 category prompts on Perplexity (was 5) | Our analyst coverage from last quarter is being picked up | Pitch the same analysts for the next product release |
| ChatGPT quotes a $29 price; actual is $49 | Buyers see wrong pricing at the moment of comparison | Fix the pricing page and the two third-party listings that carry the old number |
| Competitor X now appears alongside us in most comparison prompts | They earned two new review-site features | Prioritize review outreach in the enterprise segment |
Then add the single sentence that Penheel recommends: "Because ___ changed, we believe ___, so marketing should ___." If you cannot finish it, you do not have a finding yet.
The methods box: where trust is won or lost
AI answers are nondeterministic. Ask the same prompt twice and you can get two different brand lists. An executive who has played with ChatGPT knows this, and the first time a number moves without explanation, they will stop trusting the report.
So put a short methods box on the page, every month, in the same place. CueScout and Visible Pilot both stress this (a methods box and "transparent denominators" respectively), and I think it is the single most underused element in these reports. Include:
- The prompt set: how many prompts, and whether it changed since last month.
- Engines tracked and whether the data comes from the real interface or an API.
- Country, language and any city-level targeting.
- Date range and how many times each prompt ran.
- The denominator for every percentage ("8 of 10 prompts", not just "80%").
Keep the prompt set stable. If you swap prompts mid-quarter, say so, because a score change caused by a new prompt list is not a performance change.
Flag unequal comparison windows
Promptwatch Data shows why this matters. Its November 2026 social media citations report covers Oct 11 to Nov 9, and compares against the October report, which covered only Sep 28 to Oct 4. The report states the windows differ (30 days versus 7). Your monthly report should do the same any time periods are not like for like.
That report is also a decent example of how engines diverge. In that window, social platforms made up 13.16% of Google AI Overviews citations, 1.94% of Perplexity citations and 0.64% of ChatGPT citations. A single blended number would have hidden all of that, which is why the evidence table should always split by engine.
Annotate what the platforms did
Some of your score changes are not yours. A good report has a small "platform events" line, so the executive does not conclude the PR team lost ground when an engine changed its behavior.
Recent examples from Promptwatch Data:
- reddit.com's share of ChatGPT citations fell from roughly 4% to 0.5% on August 14, 2026. See Reddit citations are dropping in ChatGPT.
- ChatGPT started using the site: operator at scale on August 8, 2026, going from about 0.4% to about 17% of fan-out queries, per Promptwatch's site: operator report.
- Average citations per ChatGPT response dropped around the GPT-5.3 rollout on March 4, 2026, covered in the ChatGPT citation drop report.
If your Reddit-driven visibility fell in August, that annotation saves a painful meeting.
Make it a PR report, not an SEO report
Most templates online are written for SEO or GEO specialists. PR has different levers, so the report should speak to them.
Track where the citations come from
Promptwatch's ChatGPT citation share by content type data (Sep 28 to Oct 4, 2026) is useful framing for a comms audience. For branded prompts, product pages were 23.3% of citations and landing pages 22.8%. Reviews were 5.6%, FAQ 4.8%, social posts 3.0% and press releases only 2.1%.
Read that carefully. It does not say PR doesn't matter. It says the press release itself is rarely what gets cited. What gets cited is the page someone else wrote after your release, the review, the listicle, the comparison. So the PR section of your report should count earned third-party pages that AI cites, not releases issued.
For commercial prompts the same report shows listicles at 15.0% and comparisons at 7.9%, which are the placements PR can influence through outreach.
Expect shared answers
Promptwatch's unique domains per response report found that 47.6% of ChatGPT responses with citations cite 10 or more domains (Sep 28 to Oct 4, 2026). For brand-specific prompts it was only 21.3%, with 5 domains the most common count. Practically, your brand will almost always share an answer with other sources and competitors. So report position, tone and who else appears, not just "were we cited." And never judge a month on a single prompt.
Decide how far back to look
News coverage ages fast in AI answers. According to the content half-life report, news pages lost half their citations within about 36 days, while landing pages and docs held on much longer. That is a good reason for a monthly report to focus on recent coverage, and for a quarterly version to look at durable assets.
The factual accuracy log
This is the section PR leaders tend to care about most, and it is usually missing. Keep a short table of claims AI makes about the company that are wrong or outdated.
| Claim | Engine(s) | Accurate? | Source it likely comes from | Fix | Owner |
|---|---|---|---|---|---|
| Starts at $29/month | ChatGPT | No | Old comparison article | Update page, contact publisher | Content lead |
| Founded in 2014 | Gemini, Perplexity | Yes | n/a | none | n/a |
| No enterprise support | Perplexity | No | Reddit thread | Respond in thread, publish support page | Comms |
The source column is the part that makes it actionable. Wrong answers come from somewhere. Tools like Promptwatch pull the individual claims AI makes about a brand into a Brand Narrative view, and its Fact Check feature helps trace which crawled page is teaching the model the wrong thing, which saves you the detective work.
Where the data comes from
You can build this report by hand. Presenc AI says its template takes 2-3 hours manually or under 30 minutes with a tool, which is a vendor claim, but the order of magnitude feels right. The manual route is fine for a pilot: ten to twenty prompts, three or four engines, a spreadsheet, and screenshots of raw answers saved as evidence.
Once you want stable prompt sets, multiple countries, history and citations by page, a platform makes sense. A few categories worth knowing:
| Need | Options in the catalog |
|---|---|
| Monitoring plus action (content, crawler logs, traffic) | Promptwatch |
| Monitoring-focused trackers | Profound, Otterly.AI, Peec AI, Rankshift, AthenaHQ |
| Traditional SEO suites with AI add-ons | Semrush, Ahrefs Brand Radar |
| Media monitoring for the earned-coverage side | Meltwater, Brandwatch, CisionOne |
| Dashboards to assemble the final deck | Whatagraph, Microsoft Power BI, Tableau |
For a wider look, the GEO software directory lists dozens of options.
What separates tools matters for a PR report. Promptwatch collects answers from the real interfaces of ChatGPT, Google AI Overviews, Gemini, Perplexity and others, which matters because user-facing answers and citations can differ from API output. It also exports PDF reports and runs scheduled reports to inboxes, so the monthly deliverable can come together without a rebuild. Pricing starts at $95/month for Essential, with Professional at $245/month and Business at $579/month; confirm current numbers at promptwatch.com/pricing. There is a 7-day free trial and a free AI visibility report if you want a baseline first.
Connecting visibility to business outcomes
Executives will eventually ask the question the visibility score cannot answer: so what? Close the loop with at least one outcome measure.
- AI-referred visits and conversions from your analytics. Promptwatch's guide to attributing AI traffic explains the setup, including how to handle ChatGPT traffic that arrives without a referrer.
- Branded search or direct traffic changes after a coverage spike.
- Sales or support mentions: "a prospect told us ChatGPT recommended us."
Be honest about limits. AI traffic is usually a small share of total visits, and attribution is imperfect. Say that on the page. A report that states what it cannot prove gets more credit than one that implies causation.
When the score drops
It will drop. Before anyone panics, run this checklist and write the result in one line of the report:
- Did the prompt set, engines or locations change?
- Did the comparison window change length?
- Did a platform change behavior that month (see the annotations above)?
- Did a competitor gain, or did we lose?
- Is it noise? A one- or two-point move on a small prompt set often is.
Only after that should you call it a decline. GEOptimizer's template covers nondeterminism and score drops in more depth, and it is a good companion read.
Monthly versus quarterly
CueScout recommends separate versions, and it is a sound split.
| Version | Focus | Visual |
|---|---|---|
| Monthly | What changed, factual errors, next 30 days of actions | Trend line or competitor bar |
| Quarterly | Durable assets, share of voice by topic, outcomes, budget ask | Topic heatmap, traffic and conversion trend |
Don't put budget requests in the monthly. Save them for the quarterly, when you have three data points and a story.
A copyable template
Paste this into a doc or slide and fill it in.
HEADLINE
[Primary change], but [biggest opportunity / risk / competitive finding].

KPIs (current | change | definition)
1. ___
2. ___
3. ___

ONE VISUAL
[Trend / competitor comparison / topic gaps]

WHAT HAPPENED | WHAT IT MEANS | WHAT WE DO NEXT
___ | ___ | ___
___ | ___ | ___

TAKEAWAY
Because ___ changed, we believe ___, so we will ___.

METHODS
Prompts: __ (changed? y/n) | Engines: __ | Locations/languages: __
Window: __ to __ | Runs per prompt: __ | Denominators shown: y

PLATFORM EVENTS THIS MONTH
___

FACTUAL ACCURACY LOG
Claim | Engine | Accurate? | Likely source | Fix | Owner

ACTIONS
Action | Owner | Due | Expected effect
What to do this month
Pick fifteen prompts your buyers actually ask, freeze them, and run them across the engines that matter to you. Save raw answers. Fill in the template above, write the headline last, and cut the executive page until it fits on one screen. Then do it again next month with the same prompts. The second report is where it starts to be useful, because for the first time you have a trend and someone can ask a real question about it.
If your team is also deciding whether to bring in outside help for the earned-media and GEO side, that is the kind of work 1001 SEO Media does alongside its GEO platform of choice, but the report above works fine in-house.