Key takeaways
- No credible, standardized per-industry AI perception benchmark exists in 2026. Anyone quoting a clean "healthy score for SaaS vs. healthcare" table is guessing.
- The metrics themselves are well defined: visibility (mention rate), favorability (net sentiment), prominence, and citation share. Thresholds depend on your category and competitive set.
- Each AI platform has its own baseline for naming brands, so score ChatGPT, Claude, Gemini, and AI Overviews separately.
- Your best benchmark is relative: your numbers against three to five direct competitors, tracked over time, with the evidence snippets stored.
- LLM-only scores can drift from real customer sentiment, so sanity-check them against customer research.
The honest starting point: industry benchmarks do not exist yet
I went looking for a defensible table of "healthy AI perception scores by industry" and did not find one. What exists are vendor-published bands, framework definitions, and a lot of confident blog posts. The most useful sources say outright that thresholds "vary by category and competitive set."
So this guide does something different. It shows you which numbers are floating around, how much weight to give each, which industry-level data does exist (citation share, not perception), and how to build a benchmark for your own category that you can trust.
What "AI perception score" actually measures
A perception score is not one thing. It is a bundle of metrics, and different vendors blend them differently. Listen Labs' audit guide lists four core ones:
| Metric | What it tells you | Formula (per Listen Labs) |
|---|---|---|
| Visibility (mention rate) | How often you appear at all | (Queries with a mention / total queries) x 100 |
| Favorability (net sentiment) | Whether the framing is positive and accurate | (Recommended + Positive - Negative) / total mentions x 100 |
| Prominence | Where in the answer you show up | Position within the response |
| Citation share | How many source slots you earn | (Citation slots earned / total slots tracked) x 100 |
The same guide points to an August 2026 IAB framework, "Measuring Visibility in the AI Era," which groups these into four dimensions: Presence, Prominence, Portrayal, and Persuasion. The link in that source is a syndicated press release, so check the IAB's own publication before you cite it to a client.
A useful five-level rubric for each mention: Recommended, Positive framing, Neutral listing, Hedged, Negative. Hedged is the one people forget. "Some users find it expensive" is not negative, but it is not a win either.
The numbers floating around, and how far to trust them
Here is what I found, with the caveat that most of it comes from vendors selling measurement platforms.
| Claim | Source | How to treat it |
|---|---|---|
| Visibility below 8 is "pre-visibility"; 75-100 is category dominance | Listen Labs guide (updated July 4, 2026) | Vendor scale. Useful as vocabulary, not as a target. |
| Favorability: 5-10% minimal, 15-25% moderate, 35%+ strong | visiblie.com, quoted in a Listen Labs piece | Single-source. Note it describes how often mentions turn into endorsements. |
| Claude names brands in 97.3% of responses, ChatGPT 73.6%, AI Overviews 48.5% | Secondary source cited by Listen Labs | Unverified chain. Directionally useful: platforms differ a lot. |
| Brands are about 6.5x more likely to be cited via third-party sources than their own domain | studiomader.it | Unverified. Do not put it in a deck. |
The platform baseline claim matters more than any score band. If an engine names a brand in nearly every answer and another does so in under half, a 40% mention rate means something completely different on each. Treat each platform as its own baseline and never average them into one number without showing the split.
Why an industry-wide "healthy score" is the wrong goal
Three reasons.
First, category structure changes the math. In a market with five dominant players, a 20% mention rate might be solid. In a fragmented market where models list ten or more options, the same rate could be mid-pack.
Second, citation behavior varies by vertical. Promptwatch Data shows how different the source mix is: for healthcare prompts, government and public health sites earn almost half of ChatGPT citations (Sep 9 to Oct 8, 2026), with NIH, the FDA, and the NHS leading. For travel, booking and search sites earn more than half (Sep 28 to Oct 4, 2026). For software, documentation and help centers take the largest share, with GitHub, Microsoft's docs, and G2 on top. In automotive, marketplaces like Autotrader and Cars.com outrank every car brand (August 2026).
That is citation share, not perception. But it tells you something a score cannot: in healthcare, a brand's narrative is shaped mostly by institutions it does not control. In travel and automotive, it is shaped by aggregators. In software, by docs and review sites. Your realistic ceiling for owned-source citations differs by industry, so a "healthy" self-citation rate does too.
Third, slot counts differ by engine. Promptwatch's average sources per response data shows ChatGPT citing about 5 sources per web-search answer, while Google AI Overviews and Perplexity sit near 10. Fewer slots means a harder fight for citation share on ChatGPT. And almost half of ChatGPT responses cite 10 or more unique domains in a recent week, so the picture shifts depending on prompt type and period.
Rough reading guide by industry type
I will not invent numbers. What I can offer is what to watch for, based on how sources behave in each type of market.
| Industry type | What shapes the narrative | What a healthy profile looks like |
|---|---|---|
| Healthcare and pharma | Government, public health, and medical institutions | Accurate claims matter more than raw mentions. Watch for inaccurate or hedged statements. |
| Travel | Booking and search aggregators, review platforms | Visibility inside aggregator citations, consistent sentiment across them |
| Software and SaaS | Docs, GitHub, G2-style review sites | Strong favorability on features and pricing themes, cited docs |
| Automotive and retail | Marketplaces and review sites | Prominence in comparisons, not just mention rate |
| Local and multi-location | Directories, maps data, reviews | Consistency of facts across listings |
In every row, the goal is the same: be named, be described accurately, be positioned early, and be supported by sources AI trusts in your category.
Build your own benchmark in five steps
This is the part that actually works. It follows the audit method from the Listen Labs guide, with a few opinions of mine added.
1. Write a prompt library of 30 to 50 queries per product line
Split them across themes such as "best," "alternatives," "pricing," and "integrations." Cover three intent types: best-in-class, problem-aware, and comparison-focused.
2. Leave your brand name out of most prompts
Brand-name prompts inflate share of voice because they force the model to mention you. Keep them in a separate bucket if you want to study what AI says about you directly.
3. Run each prompt three times per engine
One response is not a measurement. Use fresh, logged-out sessions where you can, the same 24-hour window across ChatGPT, Claude, Gemini, and Perplexity, and a consistent region and language.
4. Store the evidence snippet around every mention
Black-box scores are useless when a client asks "why is sentiment down?" The snippet tells you whether the issue is pricing, security, support, or something else.
5. Benchmark against competitors, not a universal number
Pick three to five direct competitors and score them with the identical prompt set. Your healthy score is one that holds up in that comparison and trends upward. Rerun monthly. Models change, and so do the sources they lean on.
The say-do gap
LLM scores can disagree with how real customers feel. A model may call your brand "trusted" because of old press coverage while recent customers are frustrated. Listen Labs calls this the Say-Do Gap and recommends pairing audits with customer interviews. Whether or not you buy their platform, the point holds: validate the AI view with surveys, reviews, or support data before you act on a score alone.
Tools for measuring brand narrative in AI
You can run the audit above by hand in a spreadsheet. It gets tedious fast, especially with repeat runs and multiple markets. Most teams move to a platform.
Promptwatch is the one I would look at first for narrative work specifically, because Brand Narrative pulls out the individual claims AI makes about you and your competitors, groups repeated ones, and scores themes like Pricing, Features, Support, and Reputation from 0 to 100. Fact Check (Business plan and up) lets you mark a claim accurate or inaccurate and then finds the pages on your site teaching the model the wrong thing. It tracks the real interfaces of ChatGPT, Gemini, Perplexity, Google AI Overviews, and others, and it separates visibility score, sentiment, and position so you can see which problem you actually have. Pricing starts at $95/mo (check promptwatch.com/pricing).
Other options in the directory worth a look:
Sight monitors brand mentions across AI models, with sentiment and competitive benchmarking.
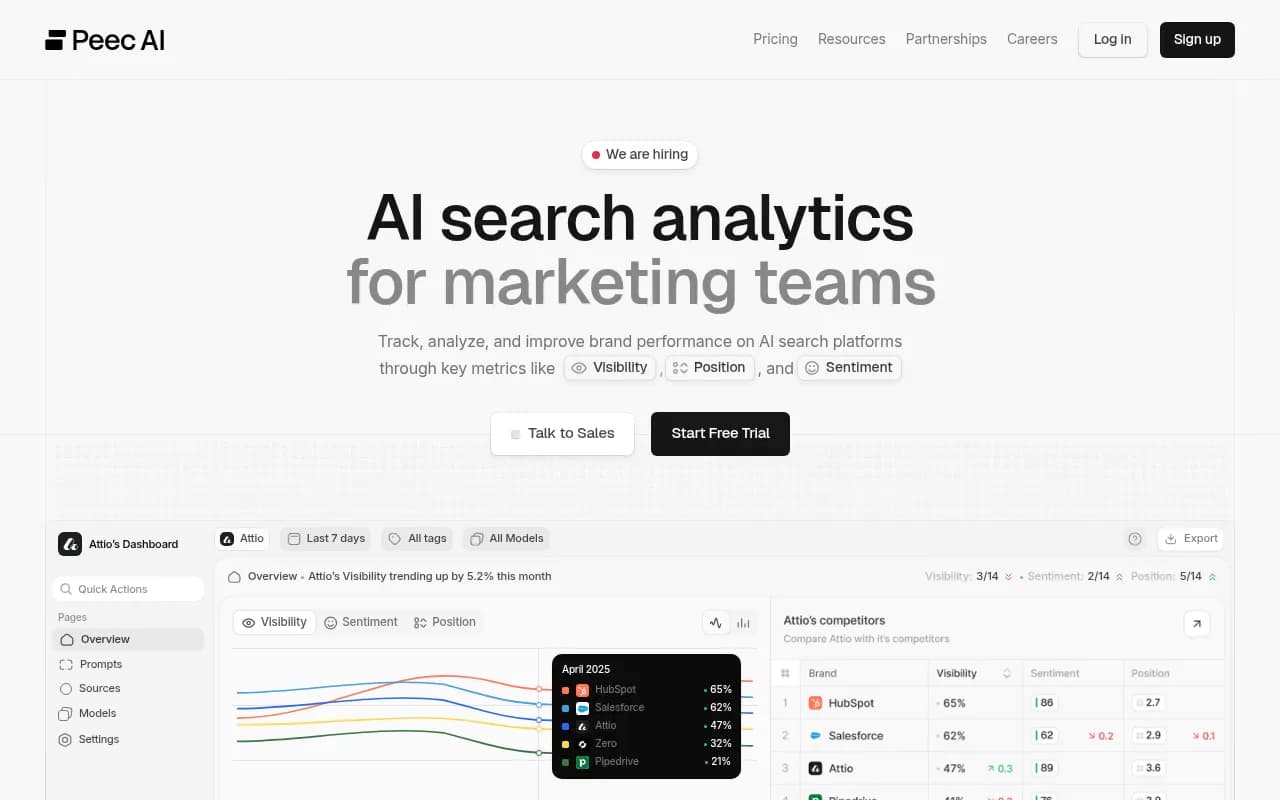
Peec AI is a simpler prompt tracker for marketing teams.
Profound
Profound targets enterprise teams with broad engine coverage.
Semrush adds AI visibility tracking to an existing SEO suite, which is convenient if you already live there.
For wider comparisons, the GEO software directory at bestgeosoftware.com lists more options.
Reading the results: which metric points to which problem
- Low mention rate: a coverage problem. You are missing from the sources AI uses for your category.
- Mentioned but late in the answer: a prominence problem. Competitors are framed as the default.
- Mentioned with no citations to your site: a content or crawlability problem.
- Mentioned with hedged or negative framing: a reputation or accuracy problem. Find the claim and the page behind it.
Promptwatch's Academy has plain definitions of Visibility Score, Share of Voice, and citations vs. mentions if you want to align your team on terms before you start reporting.
What to report to leadership
Skip the single magic number. Show a small table: your visibility, favorability, and prominence against named competitors, split by engine, with a trend line and two or three evidence snippets. Add one line on what you changed and what moved. That is a benchmark leadership can act on, and it will survive the first hard question.
If an industry benchmark does appear later from a source with transparent methodology, add it as a reference point. Until then, your competitor set is the only honest yardstick.