Key takeaways
- A $100K AI visibility budget survives CFO review when you define the baseline, the cost lines, and the value lines before spending, not after.
- Split the model into three tiers: realized value (measured revenue and savings), trending value (leading indicators like citation share), and capability value (assets you now own).
- Build engine-level assumptions that can change. ChatGPT's Reddit citation share fell from roughly 4% to 0.5% in August 2026, so a model that assumed last year's mix was wrong overnight.
- Budget content by prompt intent and by decay rate. Landing pages and docs last; news does not.
- Re-baseline every quarter and define the kill criteria up front.
Why this model exists
Most AI visibility budgets get approved on vibes and killed on vibes. Someone senior says "we need to show up in ChatGPT," a tool gets bought, a dashboard gets screenshotted, and nine months later a CFO asks what it did. Nobody has a good answer.
The broader AI numbers are not kind to this pattern. One CFO-oriented framework cites S&P Global Market Intelligence data saying 42% of companies abandoned most of their AI initiatives, up from 17% in 2024. I haven't verified that figure independently, so treat it as directional. The lesson holds anyway: programs collapse when nobody agreed on what counts as return before the first dollar went out.
This guide gives you a spreadsheet structure you can build in an afternoon. It is a framework, not a benchmark. I could not find credible published ROI benchmarks specific to AI visibility, and anyone quoting you a universal "AI search ROI of 340%" is making it up. Your inputs have to come from your own baseline.
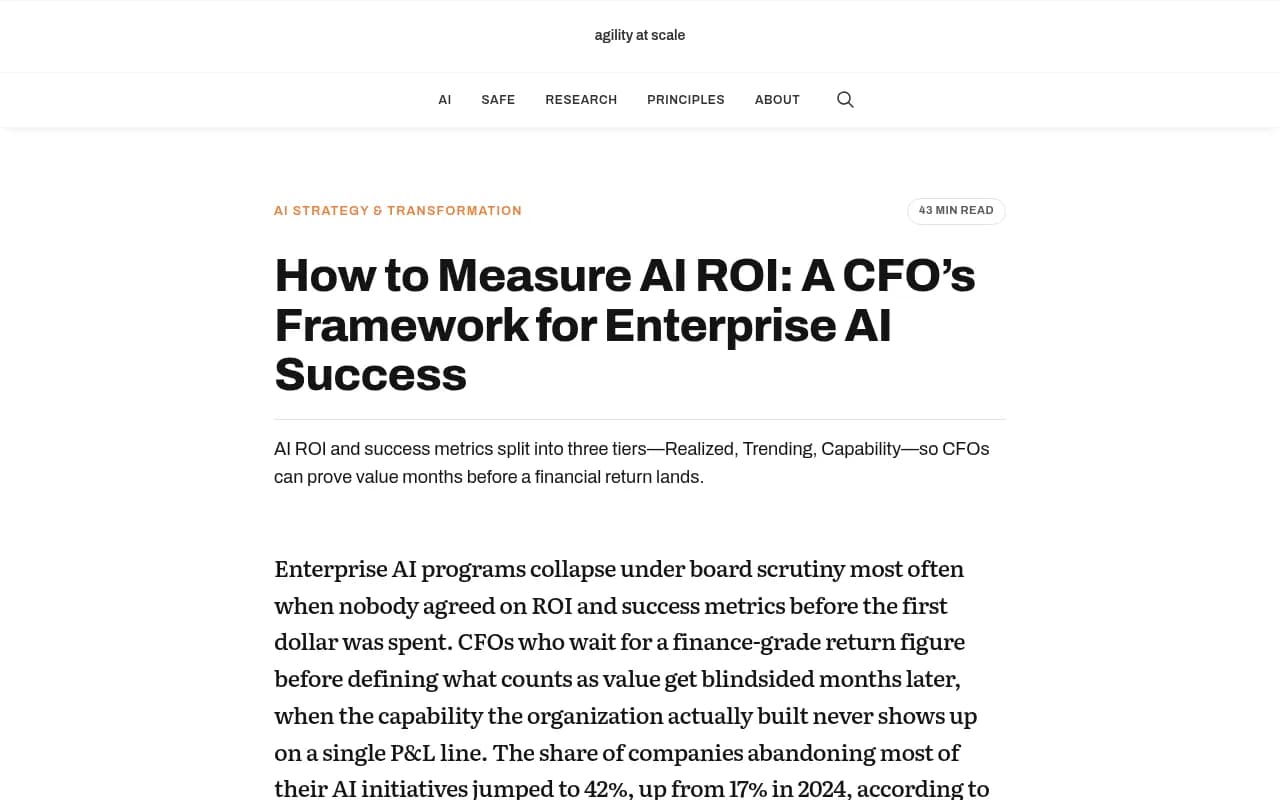
The screenshot above is from a CFO framework that splits AI return into realized, trending, and capability tiers. I borrow that idea directly, because it solves the biggest problem in this category: value shows up in leading indicators months before it shows up in revenue.
The core formula
Generative AI ROI is proven when verified savings and revenue beat full cost against a baseline. That is the whole idea, and the generic version is worth keeping:
Net value = (Realized value + Probability-weighted trending value) - Total cost
ROI % = Net value / Total cost
Payback (years) = Total cost / Annual net benefit
The payback arithmetic from one CFO guide is a useful sanity check. Spend $100,000, return $250,000 in annual benefit, and payback is 0.4 years. Those numbers come from an automation example, not AI visibility, so don't copy them. Use the structure.
Two disciplines matter more than the formula:
- Full cost means everything: licenses, people time, content production, agency fees, and analytics setup.
- Baseline means what would have happened without the program. Without it, ROI is a story.
Sheet 1: the $100K cost stack
Start with where the money goes. Here is a sample allocation for an enterprise team. Change the percentages to fit your situation.
| Cost line | Share | Amount | Notes |
|---|---|---|---|
| Monitoring and optimization platform | 25% | $25,000 | Annual license, multi-engine tracking, crawler logs |
| Content production and refresh | 35% | $35,000 | Net-new pages plus refresh cycles |
| Technical and analytics setup | 10% | $10,000 | Crawler access fixes, AI traffic attribution, dashboards |
| Internal time (loaded cost) | 15% | $15,000 | Hours times loaded hourly rate |
| Expert support or agency | 10% | $10,000 | Strategy, audits, or managed execution |
| Contingency and re-baselining | 5% | $5,000 | Quarterly reviews, model changes |
| Total | 100% | $100,000 |
A few opinions on this table. The content line is the biggest on purpose. Monitoring without production is how teams end up with a lovely dashboard and no movement. And please include internal time, even though it feels like fake money. CFOs will add it themselves if you don't, and it looks worse when they find it.
Picking the platform line
The platform choice changes what your value lines can credibly claim. A pure prompt tracker can tell you whether you were mentioned. It cannot tell you whether AI bots can read your pages, whether a published page got cited, or whether it sent anyone to your site. For a model that has to survive finance review, you want the full loop.
Promptwatch is the one I would put in the platform line for an enterprise case, because it covers monitoring, citation tracing, content creation and publishing, and visitor analytics in one place. Business is $579/mo and Enterprise is custom, so confirm current pricing at promptwatch.com/pricing before you lock the number.
If you want to compare the field before committing, the GEO software directory at bestgeosoftware.com lists the alternatives. Monitoring-focused options like [tool:profound] and [tool:otterly-ai] belong in that comparison, and so do SEO suites like [tool:semrush] if you want AI tracking bolted onto an existing contract.
Sheet 2: the baseline
This is the sheet people skip, and it is the one that saves you. Before spending anything, record for 30 days:
- Visibility Score or share of voice across a fixed prompt set, by engine
- Citation share for your domain, and self-citation rate
- AI-referred sessions and conversions from analytics
- AI crawler requests to your key pages
- Branded search volume and organic conversions (your control group)
Fix the prompt set. If you change prompts mid-quarter, you can't compare periods. Group the prompts by intent: commercial, informational, and branded. That grouping drives everything on the content sheet.
For AI-referred traffic, be careful about attribution. ChatGPT stopped sending a referrer on October 8, 2026, so untagged visits now land in direct. Use UTM-tagged links where you control them, and make sure your analytics treats utm_source=chatgpt.com as ChatGPT traffic. Promptwatch's guide on attributing AI traffic walks through the setup.
Sheet 3: the value lines
Use the three tiers. Keep them separate in the spreadsheet so nobody accuses you of blending soft and hard numbers.
Tier 1: realized value
Things you can point at in a finance system.
AI-referred conversions x average deal value x close rate
+ Agency or contractor spend avoided
+ Hours saved on content production x loaded rate
The agency line is real money. Writer's marketing ROI calculator, for instance, assumes a meaningful share of agency work can come in-house when production is automated. That is a vendor claim, so haircut it hard, but the logic of counting displaced spend is sound.

Useful reference for which inputs finance teams expect: agency spend, content volume, review rounds, and campaign counts. Borrow the input structure, not the output percentages.
One case worth knowing: Crisp reported 2x higher conversion rates from AI traffic than from traditional channels, and scaled to 5-10 articles per day. See the Crisp case study. It is one company, so don't import the multiplier, but it tells you which cell to test: conversion rate of AI traffic versus your baseline.
Tier 2: trending value
Leading indicators that predict revenue but haven't produced it yet. Assign each a probability of converting into realized value, and be conservative.
| Indicator | How to measure | Suggested weighting |
|---|---|---|
| Citation share on commercial prompts | Platform tracking by engine | Medium |
| Share of voice vs named competitors | Fixed prompt set | Medium |
| AI crawler success rate on key pages | Crawler logs | High (it is a precondition) |
| Sentiment and narrative accuracy | Brand narrative claims | Low to medium |
| Pages cited that were not cited at baseline | Page tracking | Medium |
The weighting is where finance will push back. Fine. Write down the assumption, show the sensitivity, and let them argue with a number instead of a feeling.
Tier 3: capability value
Assets and abilities you now own: a prompt library, a refreshed content base, working crawler access, a measurement stack. These don't go in the ROI percentage. List them separately as a qualitative line. They matter because they are what survives if the budget gets cut.
Sheet 4: content budget by intent and decay
Here is where first-party data earns its place in the model. Don't spread content spend evenly. Map it to what AI actually cites.
Promptwatch Data's analysis of which content types ChatGPT cites (Sep 28 to Oct 4, 2026) found product pages at 22.4% of citations and landing pages at 16.8%, so about 39% of citations go to pages describing what a company sells. Listicles were 13.6%, how-tos 8.7%, and comparisons 5.9%.
By intent, it gets more useful:
| Prompt intent | Top cited types | What to fund |
|---|---|---|
| Commercial | Product pages 26.0%, landing pages 20.6%, listicles 15.0%, comparisons 7.9% | Product and comparison pages, listicle placements |
| Informational | Product 19.1%, landing 13.9%, listicles 13.6%, how-tos 10.7%, docs 8.5% | How-tos and documentation |
| Branded | Product 23.3%, landing 22.8%, reviews 5.6% | Your own site, FAQs, review profiles |
Commercial prompts are where purchase decisions happen, so weight the budget there. Almost 70% of commercial citations came from just those four content types.
Decay and refresh costs
Content doesn't stay cited forever, and your model needs a refresh line. Promptwatch's content half-life study tracked every page ChatGPT cited on July 6, 2026 for 90 days:
- Landing pages: 78% still cited after 30 days, 69% after 60
- Docs: 76% after 30 days, 67% after 60
- Comparisons: 72% after 30 days, 63% after 60
- Product pages, reviews, how-tos: about 55% after 60 days, half-life of 74 to 77 days
- News: half gone after 36 days
The 90-day window truncates the durable types, so their real half-life is likely longer. For the spreadsheet: treat landing pages, docs, and pricing pages as durable assets with light refresh. Budget a refresh roughly every 2.5 months for product pages, how-tos, and reviews. Use news and PR for short bursts only, and never count a news-driven bump as lasting value.
Sheet 5: engine assumptions you can change
This sheet prevents the most embarrassing failure. Each AI engine behaves differently, and the behavior moves.
Promptwatch Data's social citations report for Sep 28 to Oct 4, 2026 shows how different the engines are. ChatGPT got 0.46% of its citations from social platforms. Google AI Overviews got 12.2%, about 26 times as much. Perplexity sat at 2.7%.
And the numbers move fast. ChatGPT's reddit.com share fell from about 4% to 0.5% on August 14, 2026, per Promptwatch's Reddit citation data. A plan that said "win Reddit threads to win ChatGPT" in July was quietly broken by mid-August.
So build the engine sheet like this:
| Engine | Share of your target prompts | Assumed citation behavior | Last verified | Owner |
|---|---|---|---|---|
| ChatGPT | input | Own-site pages dominate, social near zero | date | name |
| Google AI Overviews | input | Social and video matter more | date | name |
| Perplexity | input | Mixed, input | date | name |
| Gemini / Copilot | input | input | date | name |
Every cell has a date and an owner. When the date is older than 90 days, the cell turns red.
Sheet 6: scenarios and the CFO view
Finance wants three scenarios. Give them, and make the assumptions explicit.
| Scenario | AI-referred conversions vs baseline | Trending-value probability | Content throughput |
|---|---|---|---|
| Conservative | +10% | 10% | 60% of plan |
| Expected | +30% | 25% | 90% of plan |
| Upside | +60% | 40% | 100% of plan |
Those percentages are placeholders. Replace every one with a number you can defend from your baseline sheet, and keep the conservative case profitable if you can. If the conservative case loses money, say so, and explain why the downside is acceptable.
Then add the payback line. With a $100,000 budget, annual net benefit of $250,000 would imply 0.4 years. Almost nobody gets that cleanly in year one, so show payback under each scenario and be plain about the one where it exceeds twelve months.
Sheet 7: kill criteria and the quarterly review
The sheet that builds the most trust is the one that says when you will stop. Write it before you spend:
- If crawler logs show AI bots still cannot read key pages after 60 days, pause content spend and fix access first.
- If citation share on commercial prompts hasn't moved after two full refresh cycles, review the prompt set and content types before adding budget.
- If AI-referred conversion rate falls below the organic baseline for two quarters, cut the budget to the monitoring floor.
Then re-baseline every quarter: refresh the prompt set, recheck engine assumptions, and update decay rates. A tool that closes the loop helps here, since it can show whether a published page was crawled, cited, and visited. Promptwatch's Action Board and page tracking do that, and its crawler logs separate an access problem from a content problem, which is exactly the distinction your kill criteria depend on.
For a lighter-weight attribution layer, standard analytics like [tool:google-analytics] and a BI layer like [tool:looker-studio] work for the traffic side, but only if you tagged consistently from day one.
A 30-minute build checklist
- Create the cost stack sheet and total to your approved number.
- Record the 30-day baseline on a fixed prompt set, grouped by intent.
- Set up AI traffic attribution and crawler visibility before publishing anything.
- Allocate content spend by intent and decay, using the tables above as a starting point.
- Fill in the engine assumptions sheet with dates and owners.
- Build three scenarios and compute payback for each.
- Write kill criteria and put the first re-baseline date on the calendar.
If you want a quick starting point for the baseline, Promptwatch's free AI visibility report scans how ChatGPT, Gemini, and Perplexity describe your brand without a login. For a broader view of the tooling market, the directory at bestgeosoftware.com is a reasonable place to shortlist.
What to say in the room
When you present this, lead with the baseline and the kill criteria, not the upside. Finance teams have seen a lot of inflated AI projections, and the person who volunteers the downside is the person who gets the budget. Say what you measured, what you assumed, what would change your mind, and when you will check again. That is the whole pitch.