Key takeaways
- Cloudflare Logpush is the quickest route: one HTTP destination job, a host filter, and a handful of fields. Plan on 15 to 30 minutes.
- Vercel Drains need a Pro or Enterprise plan and cost $0.50 per GB, roughly 5x Cloudflare's external rate, so filter before you send.
- Fastly sends logs through its real-time streaming endpoints. I could not verify Fastly's logging pricing, so check its pricing page before you commit.
- Cost is driven by log volume, not by the number of bots. A Logpush HTTP record is about 1.5 to 3 kB uncompressed, and billing is on uncompressed bytes.
- Once logs flow, the useful part is comparing crawler share in your logs against a reference mix to spot blocked providers.
Why you want raw CDN logs for AI crawlers
JavaScript analytics never sees an AI crawler. GPTBot, ClaudeBot and PerplexityBot fetch HTML and leave without executing your tracking script. The only places they show up are your CDN, your origin server logs, or both.
The CDN is the better place to collect them. It sees every request, including ones your origin never receives because a WAF rule blocked them. That last part matters. A bot that gets a 403 at the edge is invisible in origin logs but obvious in CDN logs.
There is a second reason: spoofing. Anyone can send a request with a ClaudeBot user agent. A proper analytics tool verifies the source IP against the operator's published ranges. Promptwatch Data's AI crawler traffic report uses exactly that rule, counting a request only if the IP matches the operator's ranges, which is why its numbers are cleaner than a raw user-agent grep.
What you need before you start
Gather these first. It saves most of the hour.
- Admin access to your CDN or host (Cloudflare zone, Vercel team, or Fastly service).
- A destination. This is usually an HTTP endpoint from an analytics tool, an object storage bucket, or a SIEM.
- The exact hostnames you want logged, for example www.yourdomain.com and any subdomains.
- A rough traffic number. You will need it for the cost estimate below.
If you do not have a destination yet, pick the analytics tool first, because it dictates the URL and auth header you paste into the CDN. Promptwatch states that its crawler analytics works with Cloudflare, Vercel, Fastly and raw server logs, and its AI crawler logs feature uses IP-verified matching.
Estimate your log volume and cost first
Do this before touching any dashboard. Surprise bills are the most common way this setup goes wrong.
Cloudflare's Logpush docs give a sizing rule: an HTTP Requests record is about 1.5 to 3 kB uncompressed, and every request produces one record, including Worker subrequests. Logpush usage is measured in uncompressed bytes delivered.
| Daily requests | Approx. daily volume | Approx. monthly volume |
|---|---|---|
| 100k | 150 to 300 MB | 4.5 to 9 GB |
| 1M | 1.5 to 3 GB | 45 to 90 GB |
| 10M | 15 to 30 GB | 450 to 900 GB |
| 100M | 150 to 300 GB | 4.5 to 9 TB |
Files arrive gzip-compressed at roughly a tenth of that size, which matters for storage but not for the Logpush bill. For a precise number, Cloudflare suggests sampling one hour of traffic with Logpull and extrapolating.
What each platform charges
| Platform | Plan needed | Logging cost | Notes |
|---|---|---|---|
| Cloudflare Logpush | Self-service on Free, Pro and Business (Enterprise via account team) | 25 GB/month external included, then $0.10 per extra GB | Internal destinations (R2, Pipelines) get 25 GB then $0.03 per GB |
| Vercel Drains | Pro or Enterprise | $0.50 per GB, no included allowance on Pro | Pro is $20/month with $20 usage credit |
| Fastly | Not verified | Check fastly.com/pricing | Open-source log analytics repo claims costs are limited to Object Storage |
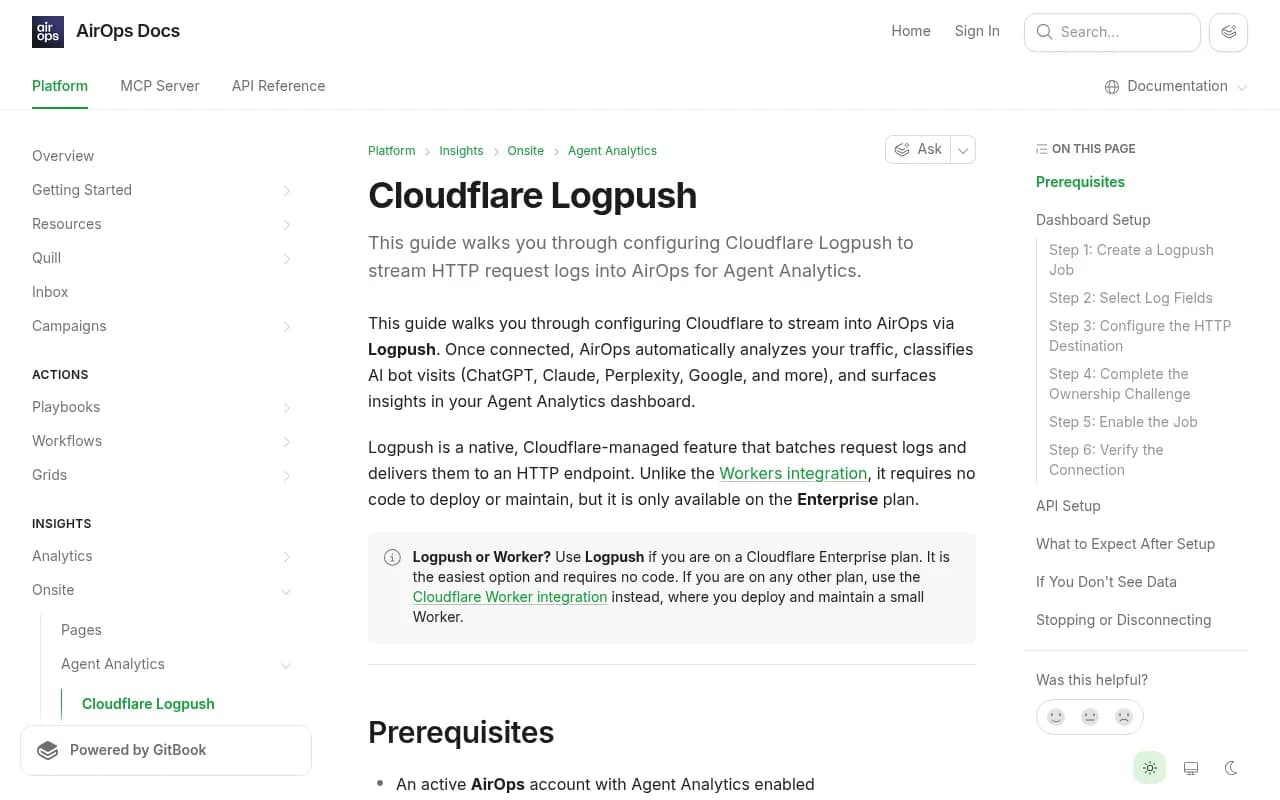
Older vendor docs still say Logpush is Enterprise-only. The AirOps guide, for one, tells non-Enterprise users to deploy a Worker instead. Cloudflare's own pricing page, updated October 12, 2026, now lists it as self-service on the lower plans. Trust Cloudflare's page over third-party docs, and confirm on your own dashboard.
Worked example from Cloudflare: 40 GB internal, 60 GB external and 5 GB transformed comes to $4.11. A mid-sized site can stay near free if it filters properly.
Option 1: Cloudflare Logpush
This is my default recommendation. The setup is short, the filtering is expressive, and the cost is the lowest of the three.
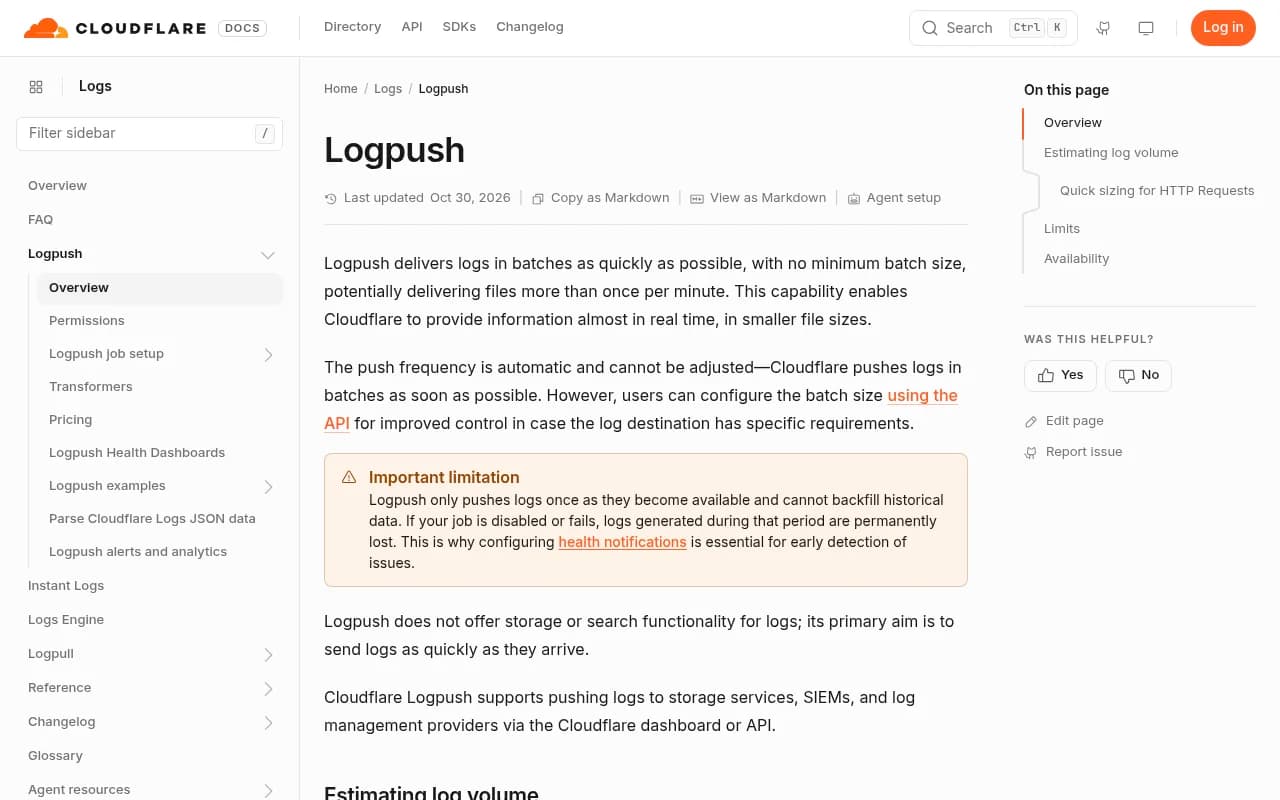
Cloudflare delivers logs in batches as fast as it can, with no minimum batch size, so you may get files more than once per minute. You cannot change the push frequency. You can set batch size through the API if your destination has limits.
Logpush does not store or search anything. It only ships logs. You need somewhere for them to land.
Step 1: Open the right place in the dashboard
Logpush jobs belong to a zone, so select the specific domain first, not the account view. Then go to Observability, then Export, then Logpush. Older dashboards put it under Analytics & Logs, then Logpush. Some vendor guides call the section Investigate.
Step 2: Create the job and pick the HTTP destination
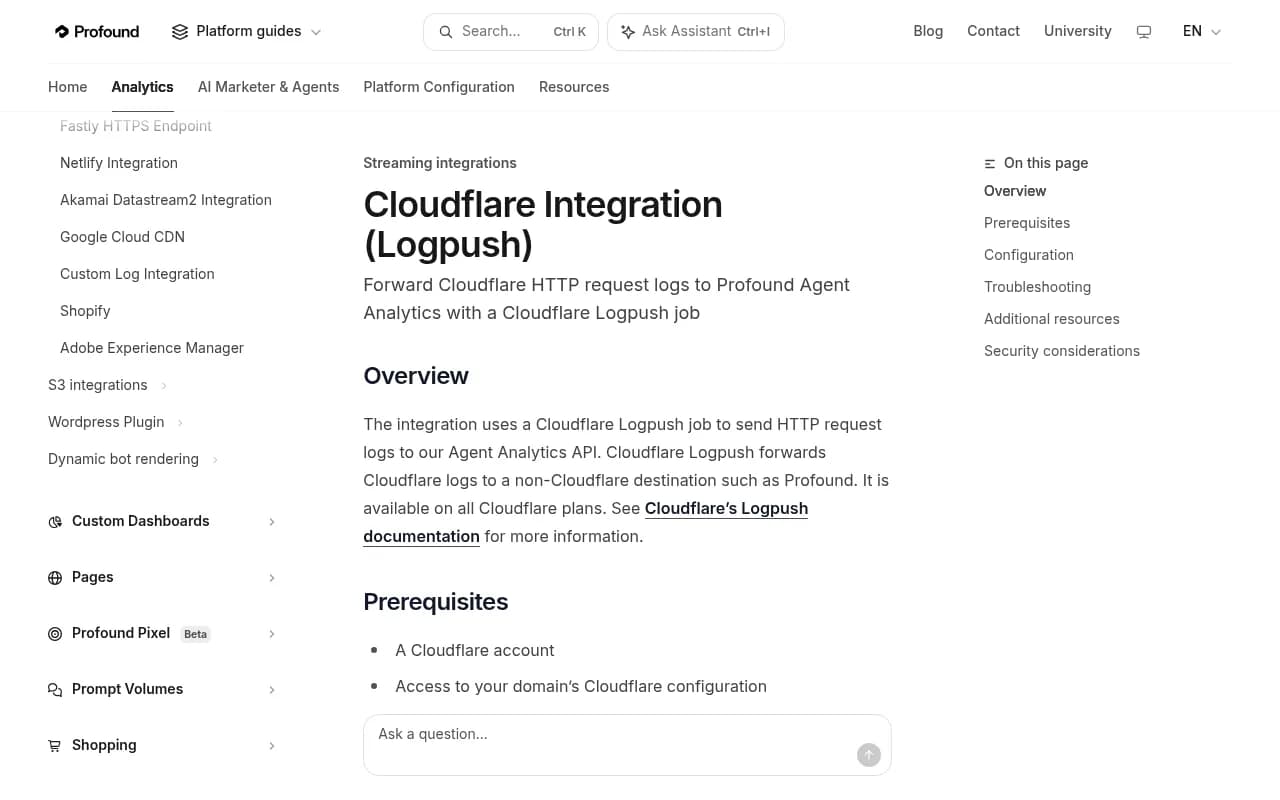
Click Create a Logpush job, choose the HTTP requests dataset, and select HTTP destination. Paste the ingest URL from your analytics tool. Most vendors put the auth key in the URL as a header parameter. Profound's format, for example, appends header_X-API-Key to its ingest URL.
Step 3: Filter by host
This is the step people skip and then regret. Choose Filtered logs and filter on the ClientRequestHost field to match your domain. Without it, every hostname on the zone gets shipped and billed.
Step 4: Select fields
You do not need everything. A minimal set that works for crawler analytics:
- EdgeStartTimestamp and EdgeEndTimestamp
- EdgeResponseStatus and EdgeResponseBytes
- ClientRequestMethod, ClientRequestScheme, ClientRequestHost, ClientRequestURI
- ClientRequestUserAgent and ClientRequestReferer
- ClientCountry and ClientDeviceType
If you want IP verification, add ClientIP. Check your tool's docs, because some analytics products require it. Extra fields and custom fields make each record larger, so add them deliberately.
Step 5: Or do it through the API
Prefer scripts? You need a Cloudflare API token with the Logs Edit permission and your Zone ID. This is the pattern AirOps documents:
curl --request POST \
  "https://api.cloudflare.com/client/v4/zones/<ZONE_ID>/logpush/jobs" \
  --header "Authorization: Bearer <API_TOKEN>" \
  --header "Content-Type: application/json" \
  --data '{
    "name": "ai-crawler-logs",
    "dataset": "http_requests",
    "destination_conf": "https://your-ingest-url?header_X-API-Key=<KEY>",
    "output_options": {
      "field_names": ["EdgeStartTimestamp","EdgeResponseStatus","ClientRequestHost","ClientRequestURI","ClientRequestUserAgent","ClientIP"],
      "timestamp_format": "rfc3339"
    },
    "enabled": true
  }'
The Ahrefs docs add a useful wrinkle: a filter with an or on ClientRequestHost, one clause for the exact host and one with endsWith for subdomains. That cuts volume cleanly if you run several subdomains.
Step 6: Verify
Cloudflare may reject the job if the destination does not answer its ownership check. If it saves, wait a couple of minutes and look for the first bot hits in your analytics tool. You can force one by requesting a page with curl and a GPTBot user agent, though a spoofed request should get filtered out by any tool that verifies IPs. That is, honestly, a handy test that verification works.
Option 2: Vercel Drains
Vercel makes the plan decision for you. Drains are available on Pro and Enterprise. Hobby and Pro Trial accounts must upgrade to Pro first. Audit Log Drains are Enterprise-only.
The bigger issue is price. Drains cost $0.50 per GB with no included allowance on Pro. That is about five times Cloudflare's external rate. For a 1M requests per day site shipping 45 to 90 GB a month, that is $22 to $45 monthly versus a few dollars on Cloudflare after the free 25 GB.
Axiom wrote about the change to Vercel log drain pricing, which is worth a read if you are comparing providers.
Setup outline
I could not retrieve Vercel's step-by-step page, so treat this as the shape of the process and follow the current docs for exact fields:
- Open your team settings in Vercel and find Drains.
- Create a drain, choose logs as the data type, and select the projects to include.
- Point it at the HTTP endpoint from your analytics tool, adding its auth header.
- Add a sampling rate or source filter if the UI offers one, so you do not pay for static asset noise.
- Check for first deliveries.
API limits to know if you automate this: drain creation is 20 per minute, updates 30 per minute, retrieval 100 per minute.
One gotcha. Vercel is a host, so some bot requests are served from edge cache and may not behave like requests to your origin. Check that your tool understands the shape of Vercel's log payload before you rely on it. Also, people running public sites on Vercel have reported AI crawler traffic blowing through usage limits, so having logs matters even if all you do is rate-limit.
Option 3: Fastly real-time log streaming
Fastly ships logs through remote log streaming endpoints that you attach to a service. Its docs describe sending logs to a third-party service for storage and analysis.
I have to be upfront here. I did not retrieve Fastly's pricing or the endpoint steps, so do not treat the outline below as a substitute for their guide at fastly.com/documentation/guides/integrations/streaming-logs/setting-up-remote-log-streaming.
Setup outline
- In the Fastly control panel, open your service and clone the active version.
- Add a logging endpoint. HTTPS endpoints work for most analytics tools; S3-compatible storage is the alternative.
- Define a log format that includes timestamp, client IP, host, URL, status and user agent. Fastly lets you write the format string yourself, so include the fields your tool expects.
- Optionally add a condition so only bot-like user agents or specific hosts are logged.
- Activate the version and watch for deliveries.
If you would rather avoid a third-party vendor, Fastly's open-source log analytics repo says your only costs are Fastly Object Storage operations and storage. That suits teams that want to query raw logs themselves.
Which one should you pick
You probably do not get to choose. Whatever sits in front of your site decides it. But if you do have a choice or run a mixed setup:
| Situation | Best fit | Why |
|---|---|---|
| Site already on Cloudflare | Logpush | Cheapest per GB, 25 GB external free, strong filtering |
| Next.js site on Vercel | Drains | Native, but filter aggressively because of $0.50 per GB |
| Fastly in front of a large property | Real-time streaming | Flexible format strings, object storage option |
| No CDN access at all | Origin logs or a WordPress plugin | Less complete, since blocked requests never show up |
What to do with the logs once they arrive
Piping data somewhere is the easy half. Reading it correctly is where people trip.
Split by crawler, not by company
Promptwatch Data's crawler report makes this point well. A provider's share can be training traffic, answer-time fetches, or both. GPTBot, OAI-SearchBot and ChatGPT-User are three different jobs. Lump them together and you cannot tell whether a page is being learned from or fetched live to answer someone.
Compare against a reference mix
In Promptwatch's data, OpenAI made up 79.8% of verified AI crawler requests in the week of Aug 31 to Sept 6, 2026, down from 94.8% in June 8 to 14. These are relative shares within each week, not absolute volumes. The report's own advice is practical: if a provider is large in the benchmark but near zero in your logs, you are likely blocked or unreachable for that provider. Check robots.txt, CDN rules and WAF rules.
The mix also moves. Meta-WebIndexer grew from about 2% to nearly 38% of tracked AI crawler requests between mid-July and August 9, 2026. A user-agent allowlist you wrote in the spring may already be wrong.
Watch status codes, not just counts
A bot that hits you 5,000 times a week and gets 403s is not reading your site. Sort by EdgeResponseStatus first. Most real problems show up as a wall of 403, 429 or 5xx on a specific crawler.
Tie it to citations
Crawling is not citing. A page can be read daily and never appear in an answer. Tools that join crawler logs to citation data close that gap. Promptwatch does it per page, showing a crawl-to-citation path so you can tell an access problem from a content problem. If you want a broader field of options, the GEO software directory at bestgeosoftware.com lists alternatives, and Profound, AirOps and Siteline AI have their own crawler analytics integrations.
Profound

Common mistakes
- Shipping every hostname. Filter by ClientRequestHost or you pay for traffic you do not care about.
- Forgetting the account scope. Logpush jobs are per zone. A job on the wrong zone logs nothing useful.
- Trusting user agents alone. Spoofed bots will inflate your numbers unless the tool checks IPs.
- Ignoring cost until the invoice. Run the volume table above before enabling anything, especially on Vercel.
- Assuming old docs are current. The Enterprise-only advice for Logpush is stale if you read Cloudflare's current pricing page.
- Setting up logs without a plan for them. Decide what question you want answered first, such as which pages are blocked or which bots visit most.
A realistic one-hour plan
| Time | Task |
|---|---|
| 0 to 10 min | Pick the destination tool, grab the ingest URL and auth key |
| 10 to 20 min | Estimate volume from your request counts and the sizing table |
| 20 to 40 min | Create the job or drain, set host filter and fields |
| 40 to 50 min | Confirm first deliveries, check for errors |
| 50 to 60 min | Compare early bot share against the reference mix, flag blocks |
The first useful insight usually appears within a day, because bot traffic is bursty. Give it 24 to 48 hours before you draw conclusions, and a full week before you compare against weekly benchmarks.
Next steps
Once data flows, the fastest win is fixing access: unblock the crawlers you want, then check whether the pages they now read start getting cited. Promptwatch's free AI crawler URL inspector and the AI bots directory help with the robots.txt side. If you want help interpreting the logs and acting on them, 1001 SEO Media runs technical SEO and GEO work for exactly this kind of problem.