Key takeaways
- We test every AI visibility tool against the same brief: define the brand and competitors, report visibility, segment prompts, benchmark rivals, and find opportunities.
- Each task gets a 0 to 5 grade, and tasks carry different weights based on how much they matter to a real marketing strategy.
- One prompt run once proves nothing. We sample repeatedly, across prompt types, and re-test when engines change behavior.
- Measurement is not the same as diagnosis or action. We score whether a tool helps you fix problems, not only whether it reports them.
- Be skeptical of any vendor ranking that puts the vendor first. We explain how to spot self-serving methodology.
Why we publish our methodology
Most AI visibility tool roundups are hard to trust. Some are written by a vendor who ranks itself first with a score like 94/100. Others are feature lists copied from product pages. A few are honest, first-hand tests that show their work.
We want to be in the third group. This guide explains how we evaluate tools, what we weigh most, and where our approach has limits. If you use it to run your own trial, even better. You will make a more confident purchase.
This site is published by 1001 SEO Media, an SEO and GEO agency. That means we use these tools on real client work, and it also means we have a point of view. We use Promptwatch ourselves, and we say so where it matters. We still score every tool against the same rubric.
What we are actually testing
AI visibility tools run prompts against AI engines such as ChatGPT, Gemini, Perplexity, Claude, and Google AI Overviews, then record whether your brand is mentioned, cited, or recommended. That sounds simple. It is not, for three reasons.
First, absolute AI visibility is impossible to know. No tool sees every question every buyer asks. What you get is a sample, so the quality of the sample decides the quality of the data.
Second, answers are unstable. The same prompt run twice can return two different answers. Supermetrics recommends sampling each prompt three to five times per engine before you trust a presence rate, and we agree.
Third, a mention and a citation are different things. An assistant can name your brand without linking you, or link you without naming you. A tool that blurs the two will mislead you.
Step 1: Pick a realistic test project
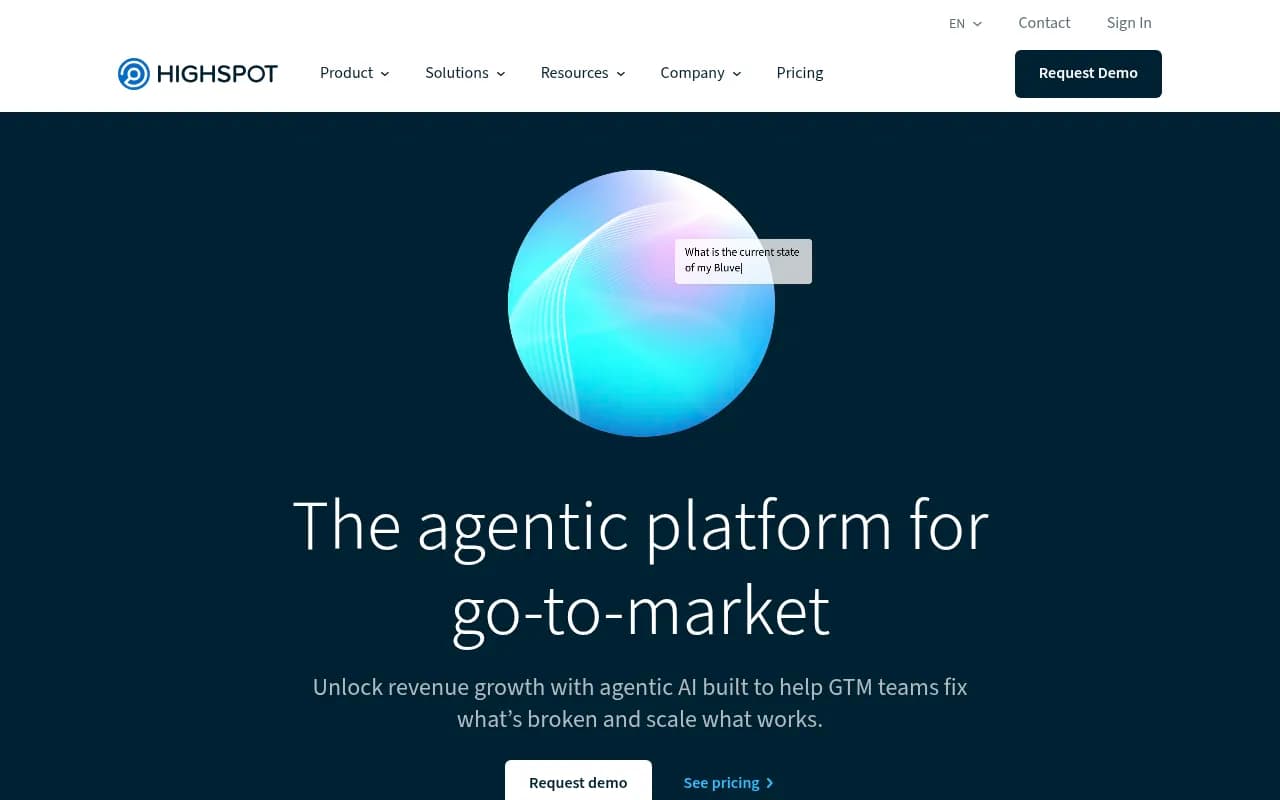
We do not test tools on toy examples. We pick a hypothetical client the way an agency would. The Overthink Group team did something similar in its 2026 ranking: they imagined a moderately large B2B SaaS company asking "How are we doing in AI search?" and chose Highspot as the test brand, because it is well known, has a clearly defined product category, and has obvious direct competitors.
We borrow that logic. A good test brand has a clear category, five to ten direct competitors, and a mix of branded and unbranded buyer questions.
Then we write the brief the client would want answered, and we fill it out in every tool as far as that tool allows.
Step 2: Run the same five jobs in every tool
Every tool gets the same brief:
- Define the target brand, branded terms, and competitors.
- Report general AI visibility: mention rate, share of voice, citation rate, sentiment.
- Segment the data. How does the brand show up in "alternatives to competitor X" prompts versus category prompts?
- Compare the brand against direct competitors.
- Find opportunities to increase visibility.
These five jobs break down into roughly 20 tasks, such as defining search parameters, labeling and segmenting prompts, generating head-to-head sentiment comparisons, and investigating citation reports for content opportunities.
Step 3: Grade each task from 0 to 5
We use a simple grade scale. Each task has its own scoring factors, but the grades mean the same thing everywhere.
| Grade | Meaning |
|---|---|
| 5 | Performs well on every factor, and the task can be done in the tool without exports. We would recommend it to clients for this task. |
| 4 | Gets the job done on the important factors, but the data needs manual work, validation, or interpretation. |
| 3 | Technically passable, but underperforms on some factors. We would not recommend it for this task. |
| 2 | Coverage or execution is too weak to be a viable candidate. |
| 1 | Signals it can do the task, but is frustratingly deficient. |
| 0 | Cannot be used for the task. |
Take "define competitors" as an example. We ask whether you can add branded variants rather than a single name and domain. We check whether the tool's suggestions are useful, and whether you can override them by blacklisting a competitor or limiting how many show. A tool that only lets you type one name per rival scores low even if its dashboard looks great.
Perfect performance everywhere would be a 5.0. In practice almost nobody comes close. Overthink's top score in its test was 3.6, and no tool felt like an across-the-board winner. That matches what we see.
Step 4: Weight tasks by how much they matter
Not every task deserves equal weight. Reading a pretty trend chart matters less than being able to tell which citations you could win. We weight tasks by how vital they are to making a real contribution to a marketing strategy, informed by client feedback.
Our weighting, roughly:
| Category | Approx. weight | Why |
|---|---|---|
| Data quality and collection method | 25% | Everything downstream depends on it |
| Segmentation and prompt management | 20% | You cannot act on a blended average |
| Competitive benchmarking | 15% | Visibility is relative |
| Citation and source analysis | 15% | This is where content opportunities live |
| Action and workflow | 15% | Reporting alone does not move anything |
| Reporting, access, and value | 10% | Seats, exports, API, cost per response |
We set weights before testing and do not adjust them after seeing results. That is the single most important rule against fiddling the outcome. Presenc AI states the same principle in its own report. The difference is that we would also like you to be wary of any ranking where the publisher also sells the top-scored product.
What we check inside each category
Data quality and collection method
This is where tools differ most, and where marketing pages say least.
- Does it collect from the real user interface of each AI engine, or only from APIs? User-facing answers, citations, and shopping results can differ from API outputs.
- How many engines are covered? Four is the floor: ChatGPT, Gemini, Claude, and Perplexity. Google AI Overviews and AI Mode matter too.
- Can you choose country and language, and are markets kept separate?
- How often do prompts run, and are runs repeated so you can see variance?
- Is the calculation of visibility, share of voice, and sentiment documented?
Tools like Promptwatch collect from the live interfaces and document how scores are calculated. We give method transparency real weight, because a number you cannot explain is not a number you can defend to a CFO.
Segmentation and prompt management
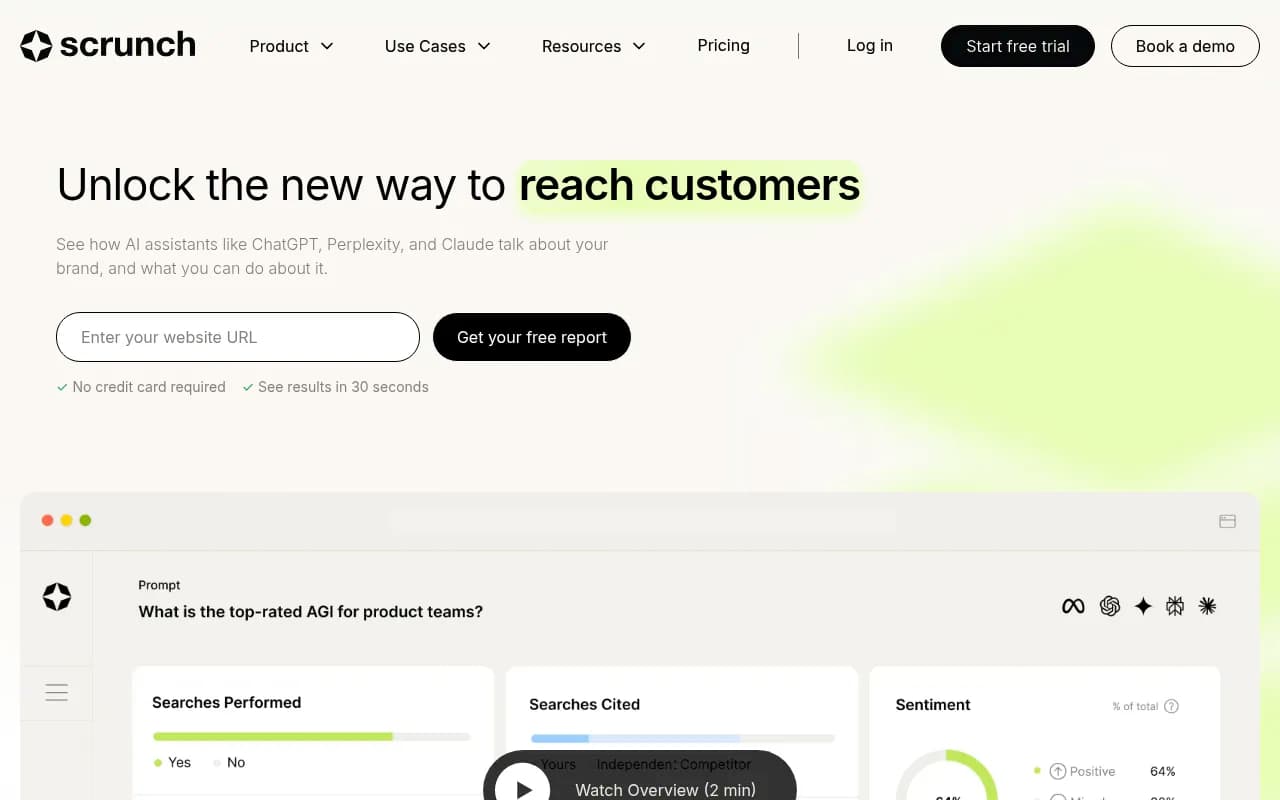
A single blended visibility score hides everything interesting. We test whether you can tag prompts by topic, intent, persona, and type, and filter every report by those labels. Scrunch earned praise in Overthink's test for segmentation architecture, and that is the sort of strength we look for.
We also check prompt discovery. Where do prompt suggestions come from? Search Console data, People Also Ask, and query fan-outs are all more defensible than a generic list.
Prompt types and sample size
We test each tool on three prompt types, because source pools differ sharply between them. Promptwatch Data's report on unique domains per ChatGPT response (Sep 28 to Oct 4, 2026) shows why:
- Organic prompts with no brand named: 52.5% of responses cite 10 or more domains.
- Competitor comparison prompts: 49.1% cite 10 or more.
- Brand-specific prompts: the most common count is 5 domains, and 21.3% cite 10 or more.
Across all prompts, 47.6% of responses cite 10 or more domains. When answers are that crowded, one prompt tells you little. We want hundreds of prompts across all three types, and we read position and description within the answer, not just whether you were cited.
Competitive benchmarking
We set up the same five to ten competitors in every tool and check three things: share of voice, position within the answer, and head-to-head sentiment. Can you see where a competitor beats you and which sources put them there?
Citation and source analysis
Citations are the raw material for content strategy. We test whether a tool distinguishes mentions from links from paraphrasing, classifies sources by type, and shows which specific URLs get cited. We also check Reddit, YouTube, and LinkedIn coverage, since the share of social citations varies a lot by engine. Promptwatch Data's social media citations report found ChatGPT drew 0.46% of its citations from social platforms from Sep 28 to Oct 4, 2026, while Google AI Overviews drew 12.2%. A tool that lumps engines together hides that.
Action and workflow
This is the category that separates dashboards from platforms. One agency case from Graph Digital makes the point: a client ran two tracking tools side by side for six months and could see exactly how invisible they were, yet could not find a single fixable cause from the outputs. Resolving a content architecture problem later lifted visibility 52% in 30 days.
So we ask: does the tool tell you what to do next? Can it write or refresh content? Does it publish to your CMS? Does it show whether AI crawlers can read your pages? Does it connect AI visibility to actual traffic and conversions? Tools that stop at the report cap out at a 3 or 4 on this category by our rubric.
Reporting, access, and value
We count seats, projects, exports, API and MCP access, scheduled reports, and cost per tracked response. Cheap per-prompt pricing means little if the plan runs prompts once a week from a single country.
How we handle engine quirks
AI engines change behavior in steps, and a tool's numbers can shift for reasons that have nothing to do with your content. Some examples from Promptwatch Data:
- ChatGPT started using the site: operator at scale on August 8, 2026, jumping from about 0.4% to about 17% of fan-out queries overnight (report).
- reddit.com's share of ChatGPT citations fell from about 4% to about 0.5% on August 14, 2026 (report).
- Average citations per ChatGPT response dropped around the GPT-5.3 rollout on March 4, 2026 (report).
- Copilot's average sources swung from under 2 to nearly 17 within weeks, per the average sources report, so we judge it on monthly trends, not weekly snapshots.
Because of this, we re-test tools periodically, and we keep a stable engine as a control. Perplexity has hovered near 10 sources per response in that data, which makes it a decent test bench. If your Perplexity numbers move while the engine is steady, your content likely changed.
We also check whether a tool models query fan-outs, the web searches AI runs behind a single response. A tool that simulates prompts without fan-out can miss the queries that drive retrieval. See our notes on query fan-outs in the Promptwatch Academy.
Cross-checks outside the tool
No tool reports AI visibility end to end, so we validate against independent sources:
- Google Search Console's generative AI performance reports, announced in June 2026, give impressions for AI Overviews and AI Mode by page, country, device, and date, but no clicks or queries.
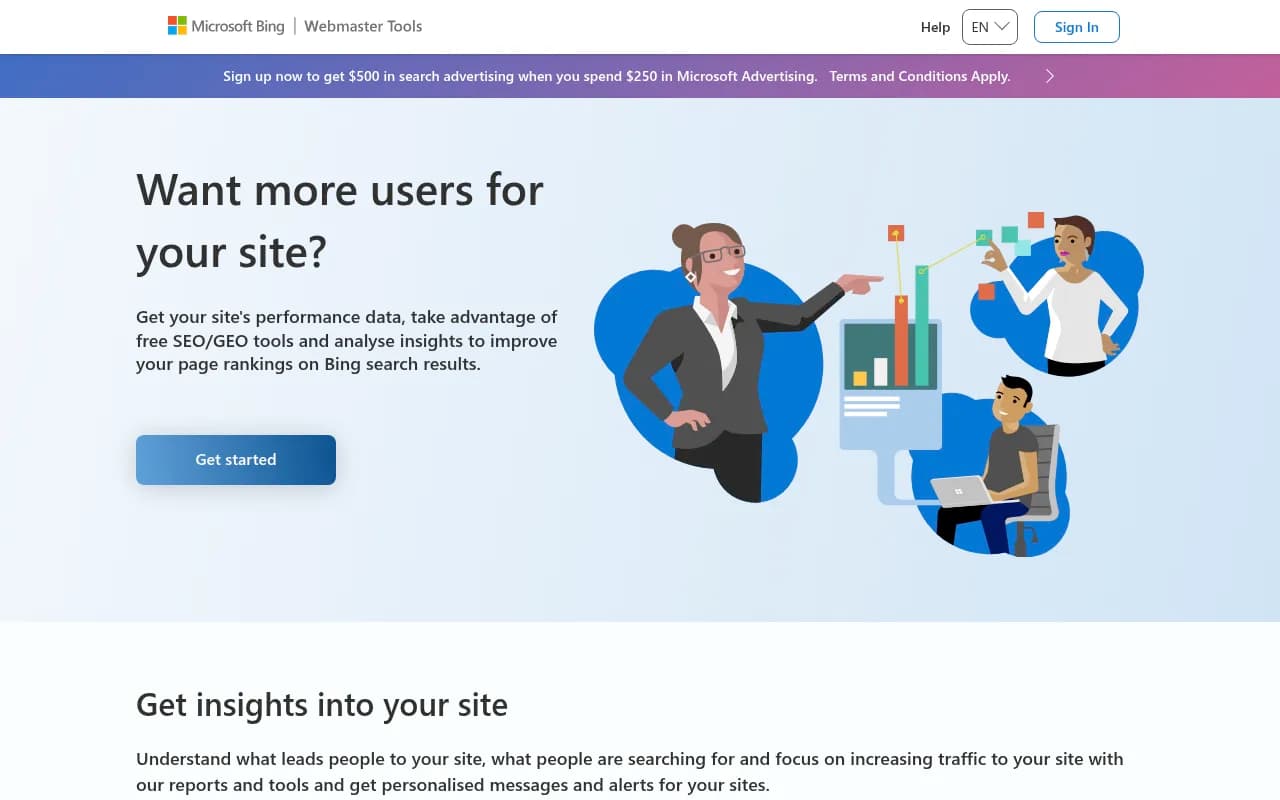
- Bing Webmaster Tools offers an AI Performance report and Citation Share for Copilot.
- GA4 groups AI assistant visits into an AI Assistant channel.
If a tool says you are cited heavily on Copilot and Bing shows nothing, one of them is wrong, and we dig in. See also Promptwatch's guide on attributing AI traffic.
How other published rankings compare
It helps to know how other methodologies work before trusting any one of them.
| Source | Approach | Our take |
|---|---|---|
| Overthink Group | 20 tasks, 0 to 5 grades, weighted, top score 3.6, hands-on test with a hypothetical client | Closest to our approach and the most transparent |
| IOD | Feature checklist: LLM coverage, prompt volume, citation split, share of voice, API, method transparency | Useful buying checklist, not a performance test |
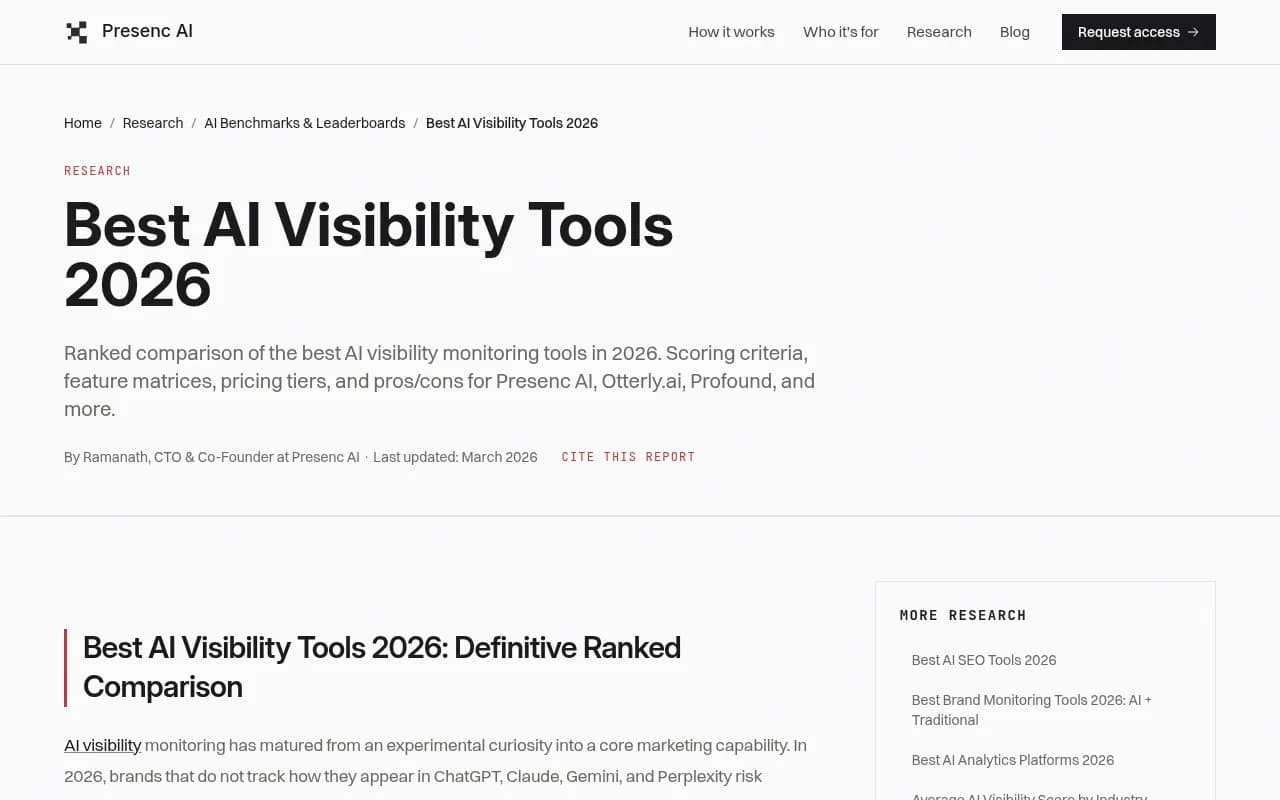
| Presenc AI | Eight weighted criteria, 90-day test, 50 brands; ranks its own product first at 94/100 | Vendor-run, so treat the ranking as marketing and the criteria as a starting point |
| Graph Digital | Qualitative, first-hand use, including beta access | Good on the limits of measurement, narrower in scope |
One line from Presenc's report is worth checking against your own test: tools covering only one or two engines miss 40 to 60% of mentions elsewhere. We could not verify that figure independently, so we use it as a reason to test coverage, not as a fact.
A quick checklist you can run yourself
You do not need our full rubric. A two-week trial with this checklist will tell you most of what you need:
- Pick one brand and five to ten competitors. Write down the questions your buyers actually ask.
- Load the same 50 to 100 prompts into each tool, covering organic, brand-specific, and competitor-comparison types.
- Confirm how each tool collects data: real interfaces or APIs, and from which countries.
- Check variance. Run the same prompt set several times and see whether scores hold steady.
- Segment by topic and prompt type. If the tool cannot, note it.
- Open the citation report. Can you find three specific pages to create or fix?
- Cross-check against Search Console, Bing, and GA4.
- Ask what happens after the report. Who writes the content, and how do you know it worked?
- Divide the plan price by tracked responses, not by prompts.
The IOD guide also suggests looking for a 14 to 30 day trial, and that is sensible. Several tools offer trials, including a 7-day free trial at Promptwatch.
Where the tools we have tested tend to land
We will publish full scorecards separately. For orientation, here is how the main categories of tools usually behave under this rubric.
| Type | Examples | Typical strength | Typical gap |
|---|---|---|---|
| End-to-end optimization platforms | Promptwatch | Monitoring plus crawler logs, content creation, publishing, and traffic measurement in one loop | Higher tiers needed for the Content Agent and faster tracking |
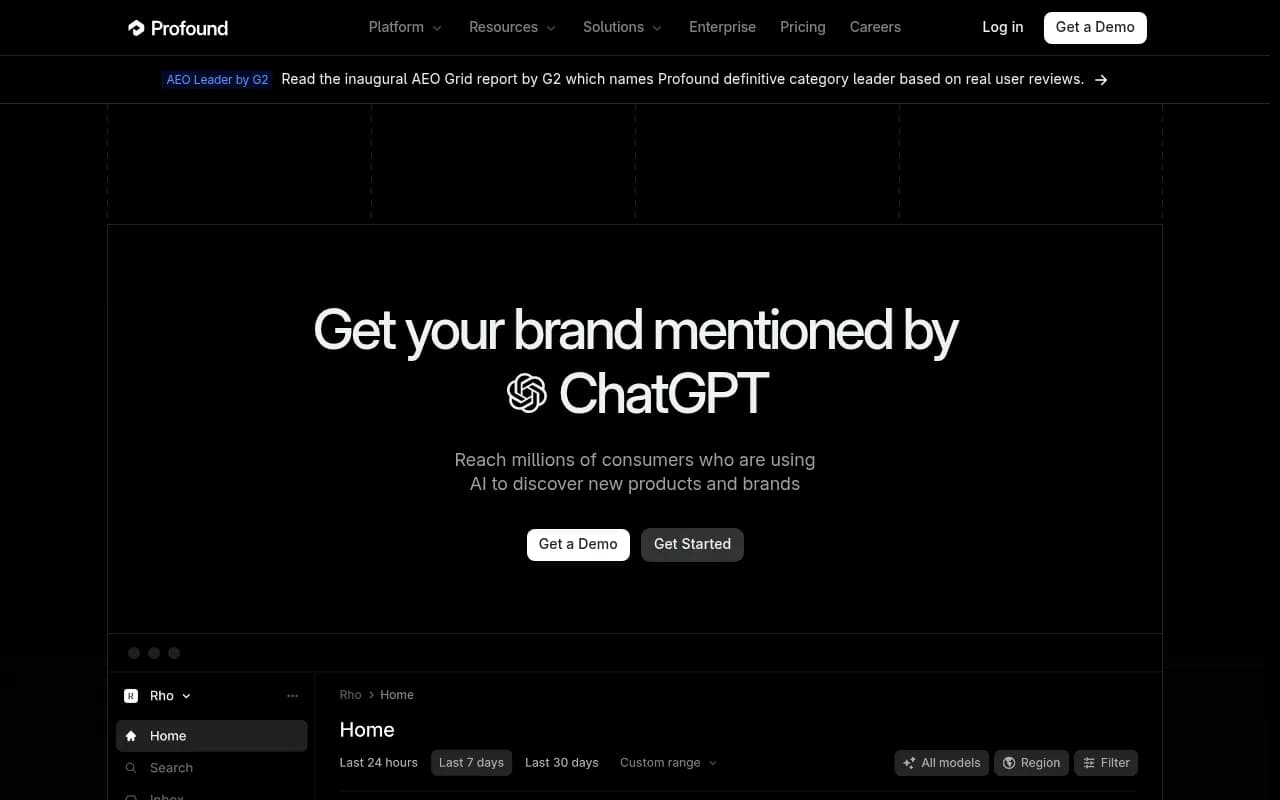
| Enterprise monitoring | Profound, Scrunch | Deep segmentation and reporting | Higher price, less execution |
| Lightweight trackers | Otterly.AI, Peec AI | Easy setup, low cost | Little beyond prompt tracking: no crawler logs or content generation |
| SEO suite add-ons | Semrush, Ahrefs Brand Radar | Fits an existing SEO workflow | Fixed prompt sets and shallower AI data |
Profound
Otterly.AI

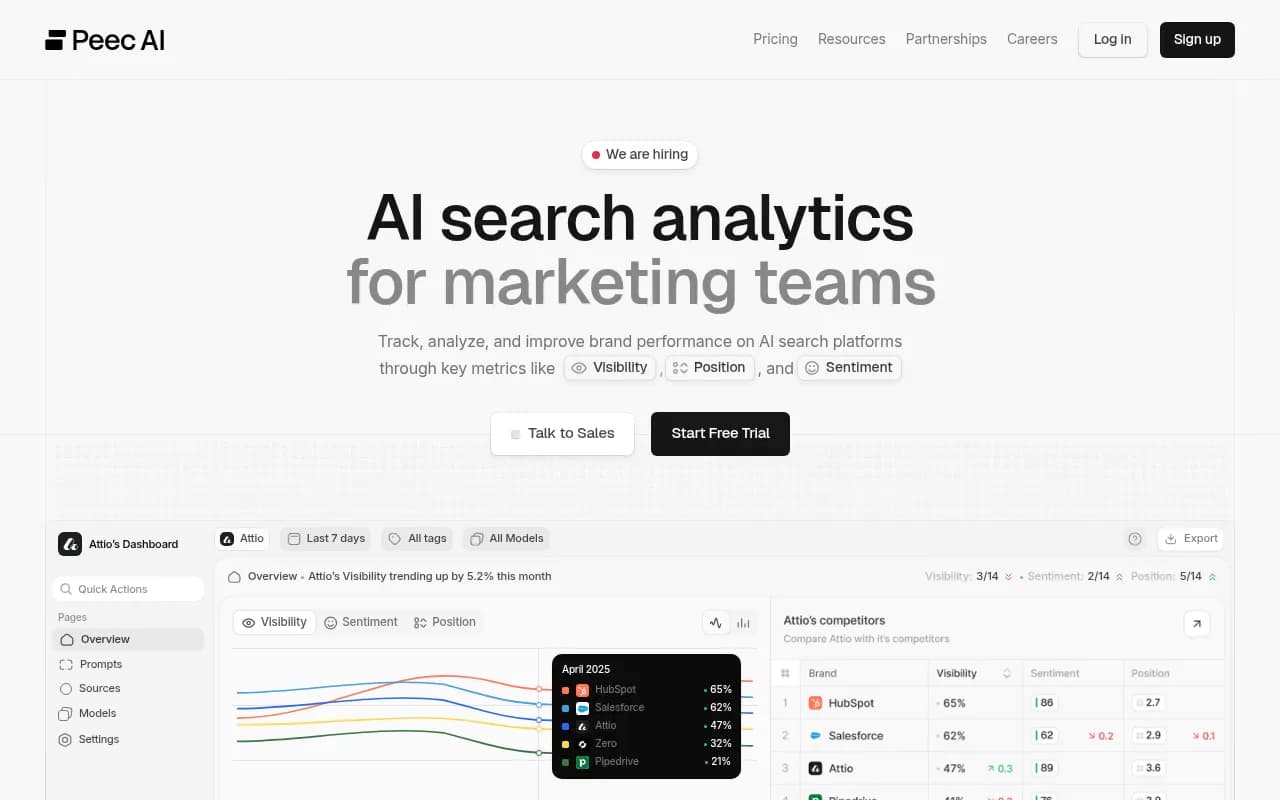
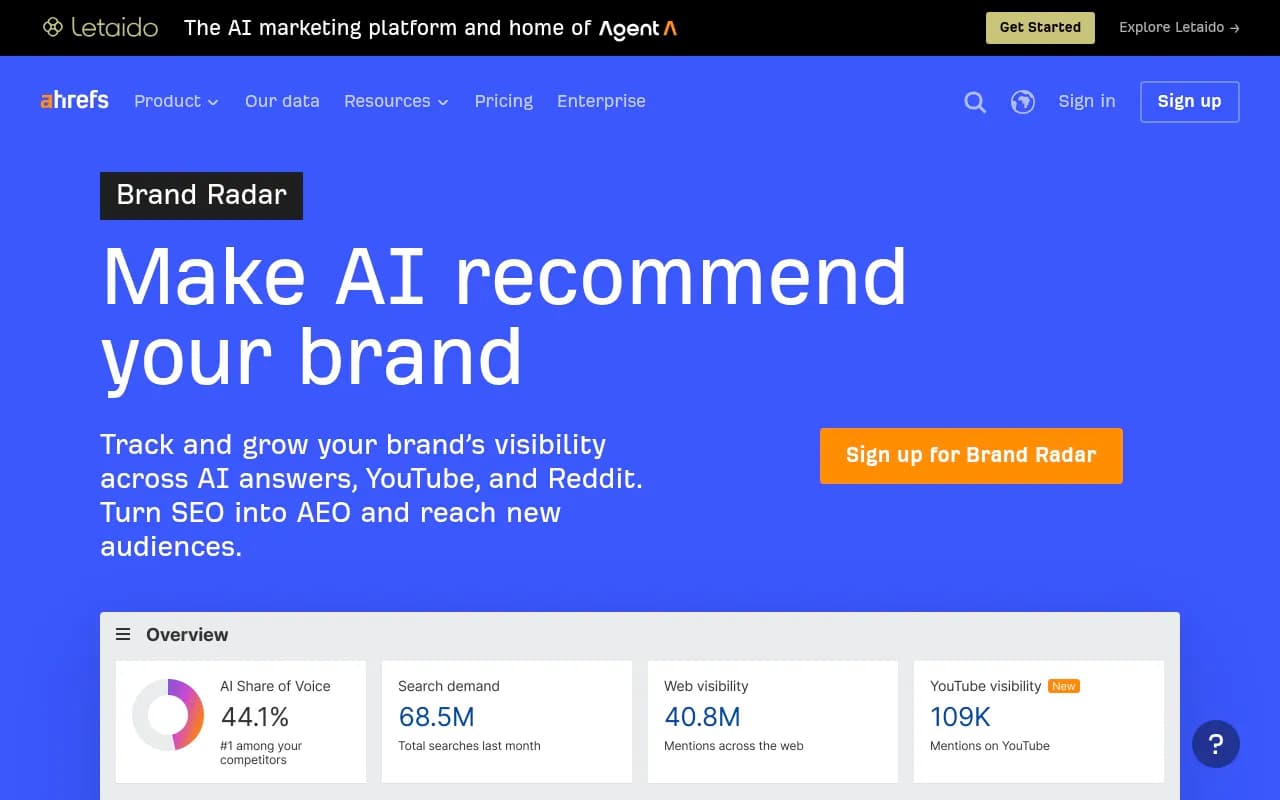
In Overthink's own ranking, Peec scored 3.2 and was praised for unlimited seats and countries at low tiers, Rankscale scored 2.9 and led on sentiment, Semrush scored 2.2 ("strong vision, weak execution"), and Ahrefs Brand Radar scored 1.1. Those are one team's grades from late 2025, and the market moves fast, so re-test before you buy.
For a side-by-side we maintain on the Promptwatch side, see the 2026 GEO platform comparison. To browse more options, the GEO software directory at bestgeosoftware.com lists dozens of tools.
Limits of our approach
This methodology has real weaknesses. We should name them.
- Our scores reflect one test project at one point in time. A tool strong for B2B SaaS may be weaker for local or e-commerce brands.
- Weights are a judgment call. If you care most about agency white-labeling, you should weight differently.
- Vendors ship quickly. A 2 today can be a 4 in a quarter.
- Tools measure symptoms. Diagnosis still needs a human who understands your content, entities, and site architecture.
That last point is why we pair measurement with site-level checks such as crawler logs and audits, rather than relying on visibility scores alone.
Bottom line
A fair test uses a realistic brief, a fixed rubric set before you start, repeated sampling, all three prompt types, and cross-checks outside the tool. Weight what drives action, not what looks good in a screenshot. And distrust any ranking where the publisher tops its own chart.
If you want to try the approach in practice, run the checklist above in a free trial or start with a free baseline from Promptwatch's AI visibility report, then compare it against whatever other tools you are considering.