Key takeaways
- AI visibility tools collect data in two ways: scraping the real consumer interfaces (ChatGPT, AI Overviews, Perplexity) or calling developer APIs. The two often disagree sharply.
- Surfer's 2026 study of 13,779 answers found overlap of roughly 30% at best, about 75% of brand lists not overlapping, and up to 95% of cited sources not matching. Surfer sells scraping-based tracking, so treat it as a strong signal from an interested party.
- Some of that gap is plain non-determinism. The same prompt asked twice does not return the same answer, so any single run is weak evidence.
- For numbers that reflect what buyers see, prefer real-UI collection, measured across many prompts and repeated runs. Use API data to understand what a model believes from training, not what the product shows.
- Before you sign anything, ask each vendor how they collect data, then run a two-week trial on your own prompts.
Why two dashboards disagree about the same brand
Picture an enterprise team with two tools. Tool A says the brand shows up in 41% of category prompts. Tool B says 14%. Both vendors insist their number is right, and both are probably telling the truth about what their own collection method measured.
The mismatch is rarely a bug. It is a method problem. An AI answer a buyer reads in ChatGPT is the output of a model, a retrieval layer, a search step, ranking and formatting, all wrapped in a consumer product. An API call to a model skips most of that. So the two outputs are different things, and averaging or comparing them as if they were the same is where enterprise reporting goes wrong.
If you have ever seen a report API disagree with the interface it supposedly mirrors (this is a common complaint in analytics products generally, such as the Microsoft Q&A thread about report API metrics not matching UI metrics), the feeling is familiar. The difference here is that the stakes are brand perception and pipeline, and the interface is not under your control.
The two ways tools collect AI answers
API collection
The vendor sends prompts to a model through a commercially available API and records the response. It is cheap, fast, stable and easy to scale. It is also a different product from what consumers use. Often the API model has no live search layer, or has one that behaves differently, and the exact model behind a consumer app is not published.
There is a wrinkle for Google. In Surfer's test, the AI Overviews "API" method had to be borrowed from AI Mode, because Google says AI Overviews runs on Gemini 3 and no such model is sold. So for that surface, an API-based tool is by necessity measuring something adjacent.
Real UI collection
The vendor runs the prompt through the actual interface a user sees, per country and language, and records the answer, the citations and any shopping or ad elements. It is slower and harder to operate, which is part of why it costs more. But the output is the thing your buyer actually read.
| Dimension | API collection | Real UI collection |
|---|---|---|
| What it measures | A model's response to a prompt | The consumer product's answer, including retrieval and citations |
| Citations and sources | Often missing or different | What users actually see |
| Live search behaviour | May not match the product | Included |
| Shopping and ad elements | Usually absent | Visible |
| Cost and scale | Cheap, easy | Heavier to run |
| Best use | Understanding model priors from training data | Reporting visibility to buyers |
What the evidence says
The most direct test I found is from Surfer, last updated October 4, 2026. They ran 1,000 prompts across five AI products, once through scraped interfaces and once through APIs, and collected 13,779 answers across 14 model-and-method combinations. They compared cited brands, sources, pages and answer length. Their headline findings:
- Overlap between API and scraped UI data was about 30% at best, and often lower.
- Roughly 75% of brand lists did not overlap. Their reading: if you measure share of voice from API data, you have around a 25% chance your report overlaps with what a buyer sees.
- Up to 95% of cited sources did not match, depending on whether you compare publishers or pages.
Two cautions, both of which Surfer states itself. First, the same prompt asked twice does not return the same answer, so part of the disagreement is non-determinism and not the channels differing. Second, no vendor exposes the exact model its consumer product serves. And of course Surfer sells scraping-based tracking. I did not find a neutral, non-vendor study of this question, and I would trust the direction of the finding more than the exact percentages.
Why the UI changes underneath you
There is a second, quieter reason to prefer real-interface data: consumer products change their retrieval behaviour without notice, and an API snapshot will not show it. Promptwatch Data, which collects from the real interfaces, documents several of these shifts:
- ChatGPT started using the site: operator at scale on August 8, 2026. Such queries jumped from about 0.4% to about 17% of fanout queries, and searches per response nearly doubled. See the ChatGPT site: operator report.
- reddit.com's share of ChatGPT citations fell from roughly 4% to 0.5% on August 14, 2026, as covered in Promptwatch's Reddit citation data.
- Average citations per response dropped across GPT-5.3, GPT-5.4 and GPT-5-Mini around the March 4, 2026 rollout, per the ChatGPT citation drop report.
- Average fanout queries per response moved from about 2.15 in early December 2025 to about 1.84 by early March 2026, and average fanout query length fell from about 117 characters to the high 80s, according to the ChatGPT query fanouts data. One quirk worth flagging: that report's intro says a prompt can trigger 3 to 8+ searches, which does not match the 1.0 to 2.15 averages in its own charts. I would use the charted averages.
My inference, not a measured result: a retrieval or model change can move a visibility number overnight, and a tool that does not reproduce the live search layer will not register it. If your dashboard is flat while your buyers' answers are changing, that is a red flag.
Why one answer tells you almost nothing
Before you throw out the whole category, accept that non-determinism is real. SparkToro's Rand Fishkin found there is less than a 1 in 100 chance that ChatGPT or Google's AI, asked 100 times, will give the same list of brands in any two responses, and closer to 1 in 1,000 before two lists came back in the same order. His conclusion, as quoted by WebYes: "visibility % across dozens to hundreds of prompts run multiple times" is a reasonable metric, while any tool giving a "ranking position in AI" is "full of baloney."
Answers are also crowded. In Promptwatch Data for September 28 to October 4, 2026, 47.6% of ChatGPT responses with at least one citation cited 10 or more unique domains, and 66.1% cited at least 8. Brand-specific prompts were the exception, with only 21.3% citing 10 or more. See the unique domains per response report. Citation volume also differs by engine. An older Promptwatch report (September 2025, so figures may have drifted) put ChatGPT at about 5 sources per answer, AI Overviews at about 10 and Perplexity at almost exactly 10, in the average sources per response data.
Put those together and the rule is simple. Trust aggregates over many prompts and repeated runs. Distrust single answers and precise ranking positions, whichever collection method produced them.
So which should you trust?
For reporting what buyers experience, trust real-UI data. For understanding what a model believes on its own, API data is a legitimate input. The mistake is treating them as interchangeable, or blending them into one share-of-voice figure.
A practical split:
- Board and executive reporting on visibility, share of voice, citations and sentiment: real-UI data, aggregated across many prompts and repeated runs.
- Model-prior analysis (what Claude, DeepSeek or Mistral answer from training data): API data is fine and often the only option, provided it is labelled as such.
- Shopping, ads and local results: real UI only, since these elements generally do not exist in API outputs.
- Anything that claims a precise "rank" inside an answer: discount heavily either way.
Why enterprise brands get burned most
Enterprise brands have the most to lose from a bad number. A September 2026 piece in Demand Gen Report by Shane Tepper cites three 2026 audits. The Fuel AI Index (1,000 enterprise domains) found 62% technically invisible to generative AI. The Pulp Strategy GEO Benchmark (408,000 prompt simulations across 350 brands) found 68% of brands absent from AI-generated lists in their own categories. These studies measure differently, and the article's point is that they converge anyway.
The uncomfortable corollary is that a brand can rank on page one for thirty commercial keywords and still be missing from the shortlist a buying committee reads. If your visibility tool is quietly measuring a model that shows your brand while the consumer product does not, you will believe you are fine. That is the expensive failure mode, and it is the one a method audit prevents.
How to audit any AI visibility vendor
Ranketta's buyer's guide lists seven criteria for comparing tools: brand or product-level tracking, engines on your plan, prompt capacity, collection method, evidence behind each number, what happens after the report, and what drives price. It also recommends checking claims in vendor docs, not homepages, and trialing before an annual plan. Collection method is the one that decides whether your numbers mean anything.
Questions to put to every vendor in writing:
- For each engine, is the data from the real consumer interface or an API? Which one for AI Overviews?
- Can I see the raw response and the citation list for any data point?
- How many runs per prompt, and how do you handle variance?
- Do you collect per country and language, and are those fixed per monitor?
- Can you show me a retrieval change (like the ChatGPT site: operator shift in August 2026) appearing in your data?
- Does the tool connect visibility to your own site: crawler logs, AI-referred traffic and conversions?
Then run a parallel trial. Pick 50 to 100 of your real prompts, run two vendors for two weeks, and compare the brand lists and sources against what you see by hand in the live interfaces. Expect noise. You are looking for systematic gaps, such as one tool never showing a source type you can see in the real product.
Tools to look at
This is a quick orientation, not a ranking. Verify each vendor's collection method yourself using the questions above, because docs and plans change.
Promptwatch collects from the real user interfaces of ChatGPT, Google AI Overviews, AI Mode, Copilot, Gemini, Perplexity, Meta AI and others, per country and language, and tracks API models such as Claude, DeepSeek and Mistral alongside to show what models believe from training data. It labels that split rather than blending it, which is the behaviour you want. It also goes past monitoring with IP-verified AI crawler logs, visitor analytics and a content agent, so you can tell an access problem from a content problem. Pricing starts at $95/mo for Essential, and a 7-day free trial and a free AI visibility report are the starting points; confirm current plans at promptwatch.com/pricing.
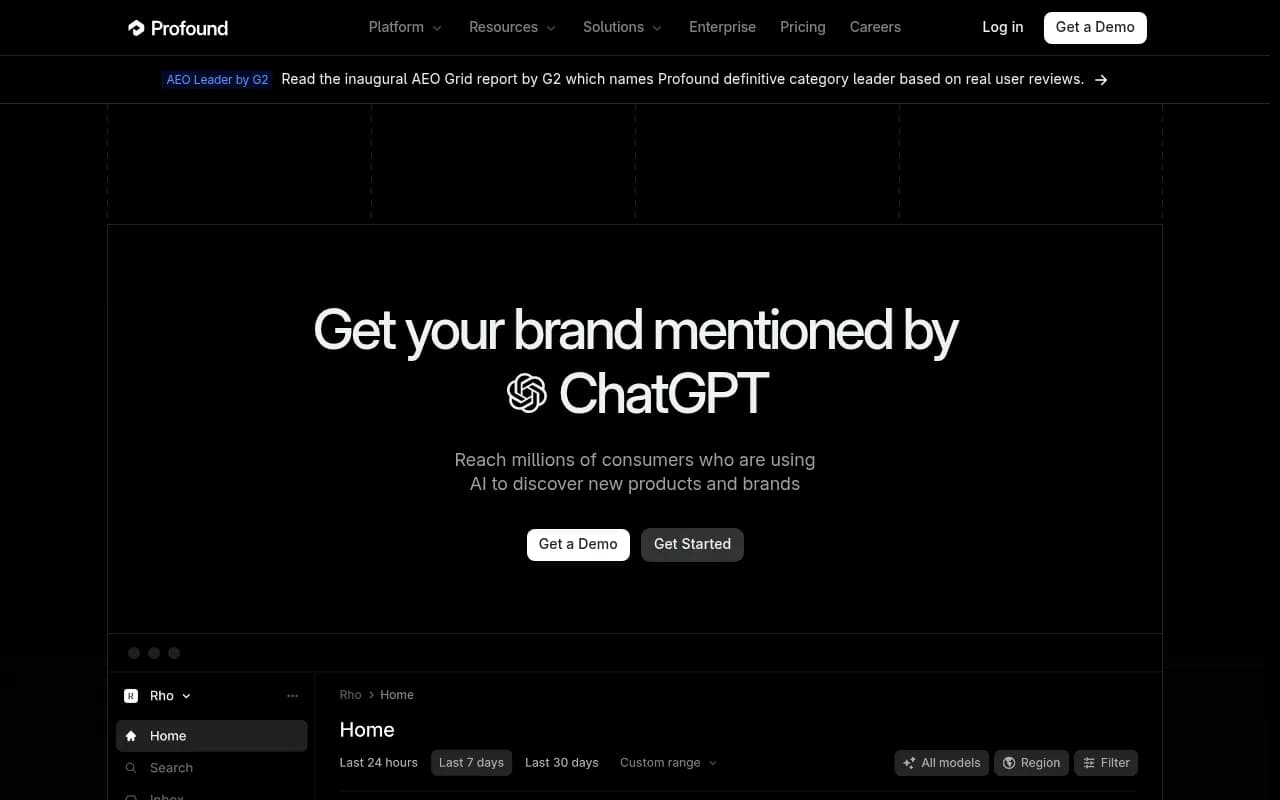
Profound is an enterprise-positioned platform tracking many AI engines.
Profound
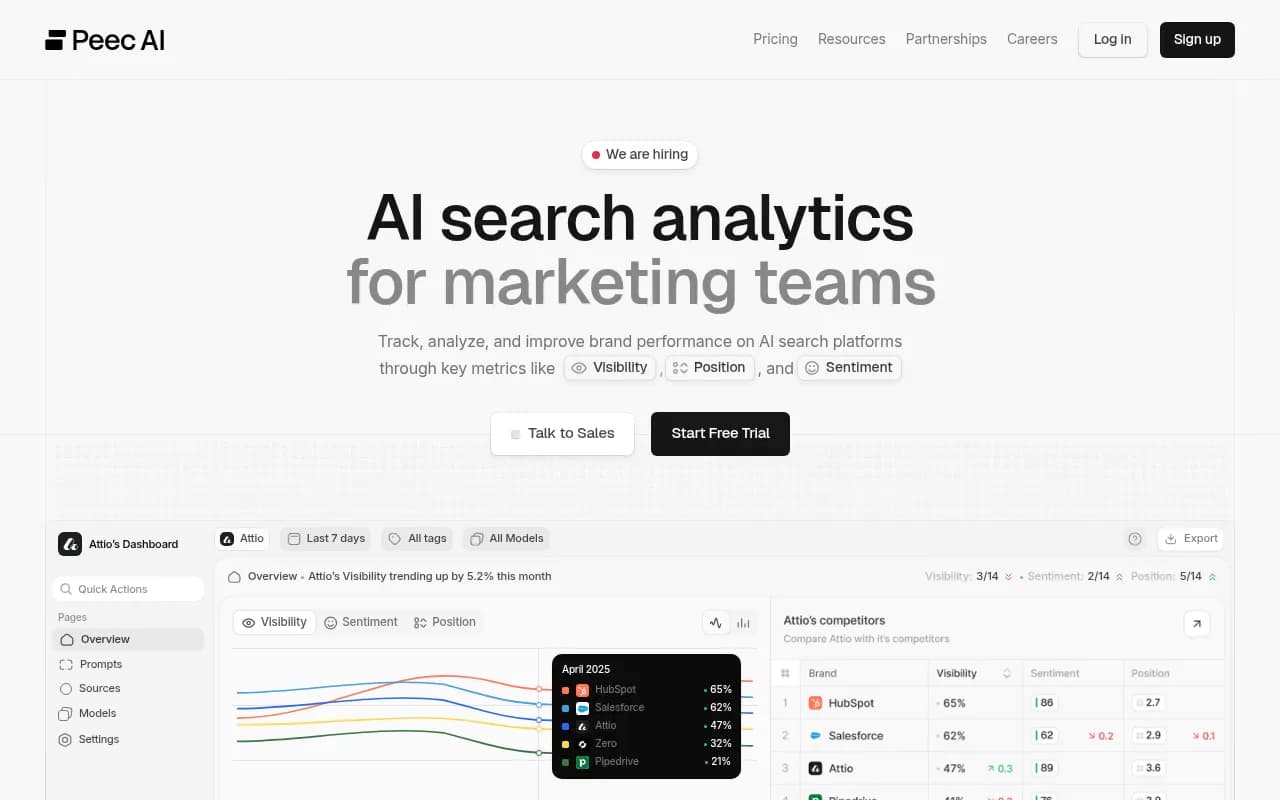
Peec AI and Otterly.AI are lighter prompt trackers aimed at marketing teams.
Otterly.AI

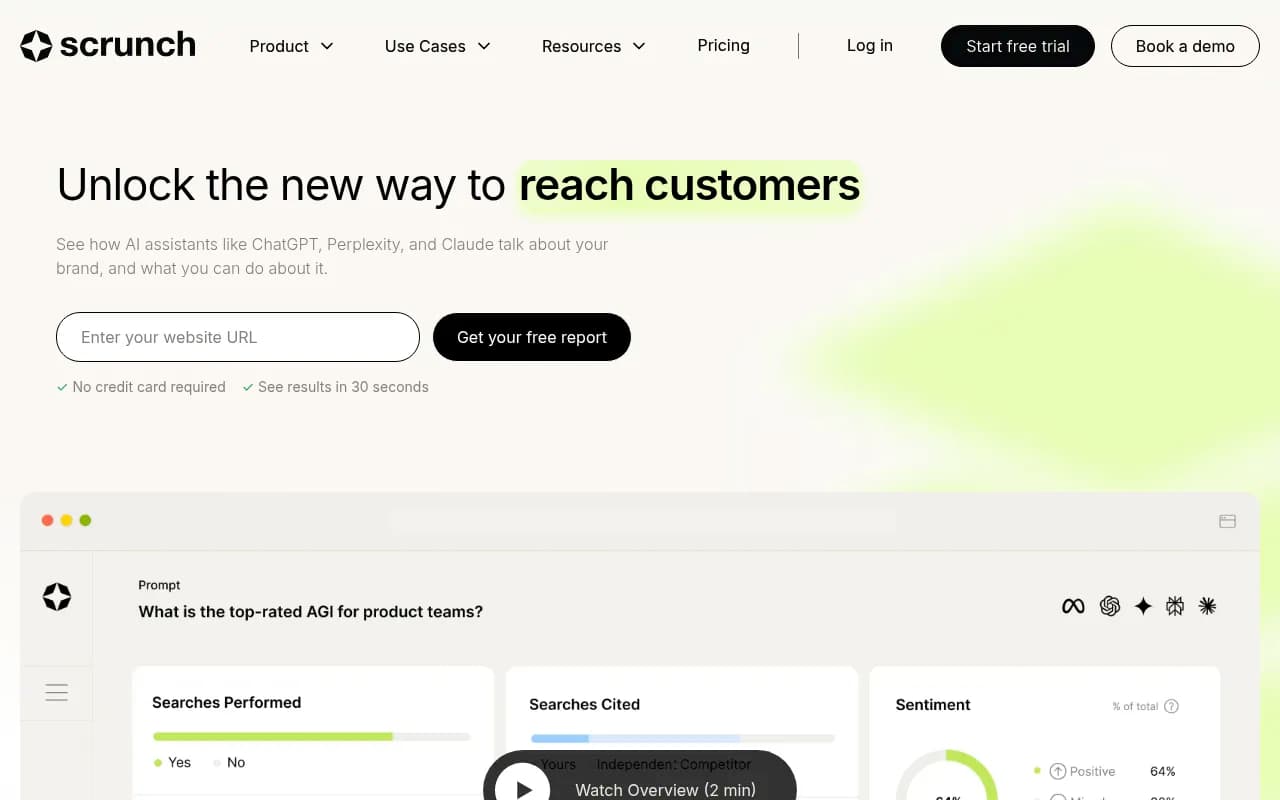
Scrunch and AthenaHQ are monitoring-focused options worth including in a trial.

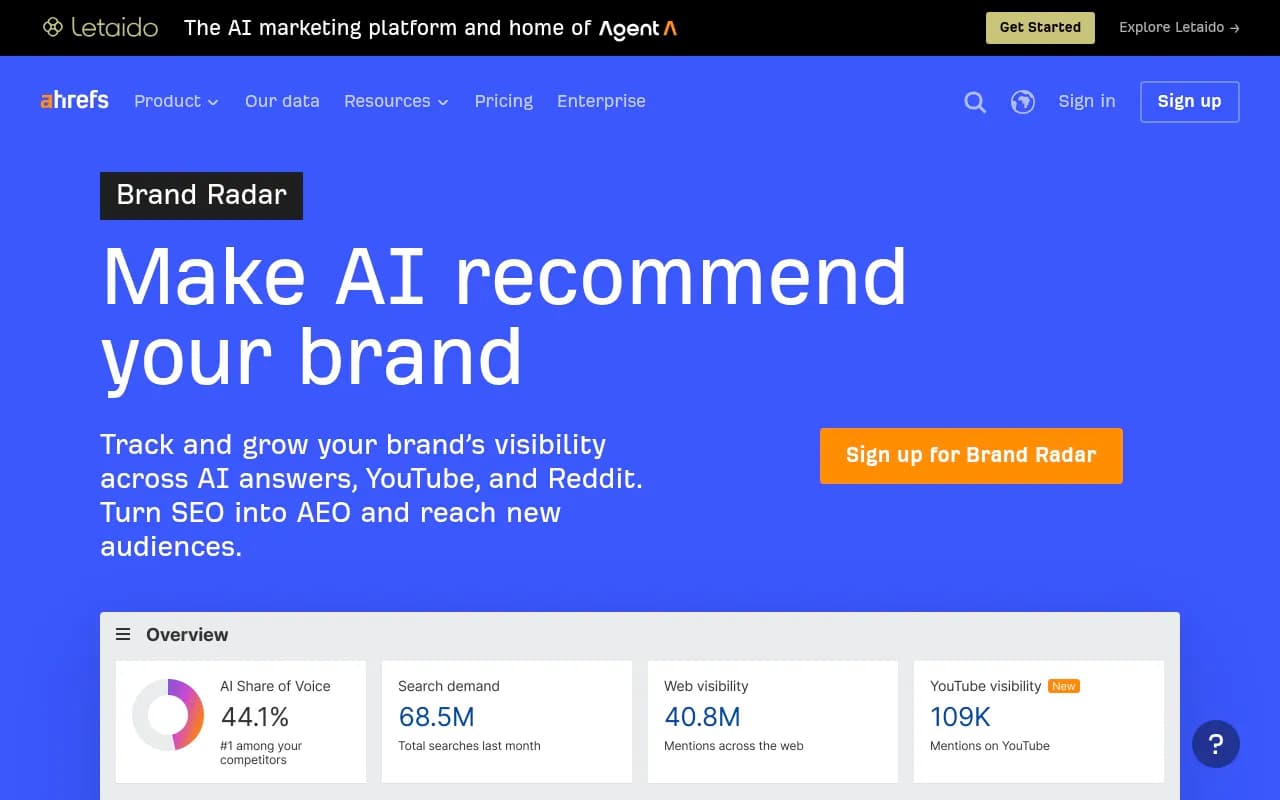
If you already live in an SEO suite, Semrush and Ahrefs Brand Radar add AI tracking, though you should ask hard questions about prompt set flexibility and collection method.
| Tool | Position | Ask before buying |
|---|---|---|
| Promptwatch | End-to-end platform: real-UI tracking plus crawler logs, traffic, content agent | Plan limits on prompts and responses |
| Profound | Enterprise monitoring | Collection method per engine, price |
| Peec AI / Otterly.AI | Lightweight prompt tracking | Crawler logs, traffic attribution, content tooling |
| Scrunch / AthenaHQ | Monitoring-focused | Content and publishing workflow |
| Semrush / Ahrefs Brand Radar | SEO suites with AI tracking | Fixed prompt sets, depth of AI-specific data |
For wider browsing, the GEO software directory at bestgeosoftware.com lists more options, and Promptwatch has a head-to-head comparison of GEO platforms if you want a feature-by-feature view (note it is published by a vendor in the comparison).
Tie the numbers to business outcomes
Even perfect data is a vanity metric if no one acts on it. Wil Reynolds of Seer Interactive argued on the No Hacks podcast that visibility only pays off when you track it against leads and conversions: "if you don't track those two metrics against each other, you're the sucker." That is the real test for any number, API or UI. Does it move when AI-referred traffic and conversions move? If not, find out why before you present it to the board.
A short decision checklist
- Label every number with its source: real UI or API.
- Never blend the two into one share-of-voice figure.
- Report ranges across many prompts and repeated runs, not single answers.
- Ignore claims of a precise ranking position inside an answer.
- Re-verify when a major model or retrieval change lands, since overnight shifts happen.
- Correlate visibility with crawler activity, AI traffic and conversions.
The two dashboards in the opening example are not in a fight. One probably measures what the model says, the other what the product shows. Decide which question you are asking, then buy the data that answers it.