Key takeaways
- Native dashboards in AI visibility tools are the most accurate source of the data, but few agencies want clients logging into five different logins every month.
- Whatagraph is the polished, white-label option for cross-channel reports. Its Max plan starts from $812/month billed annually, and its pricing page lists "AI visibility" only in the Mid and Heavy agent-usage tiers, not in Base.
- Looker Studio is free and flexible, but you build and maintain everything yourself, and non-Google sources usually need a paid connector.
- The best setup for most agencies is a hybrid: keep the GEO platform as the system of record, push a fixed set of metrics into one client-facing report, and keep the prompt set constant month to month.
- Whatever you pick, report mention rate, share of voice and citations against a stable baseline per engine. Screenshots of a single chatbot answer prove very little.
The actual problem: AI visibility data lives somewhere else
Agency reporting was already messy. A Databox survey cited by Raccoon AI says 77% of agencies pull data from five different tools to prepare for one reporting meeting. Now add AI visibility on top: prompts tracked across ChatGPT, Gemini, Perplexity, AI Overviews and others, plus citations, sentiment and competitor share of voice. That data lives in a GEO platform, and your client expects it next to organic traffic, paid, and conversions.
So the question is not really "which dashboard tool is best." It is "where do you want the client to look, and how much work are you willing to do every month to keep it correct?" Three realistic answers:
- Send clients into the native dashboard or PDF export of the AI visibility tool.
- Pipe the data into Looker Studio and build your own report.
- Pay for a reporting layer like Whatagraph that sits on top of everything.
I'll go through each, then get into what you should actually put in the report, because that part matters more than the tool.
Option 1: native dashboards
Native dashboards are what the GEO tool gives you out of the box. They have two big advantages: the data is fresh and the definitions are exactly the ones the tool uses. Nothing gets lost in a connector or a blend.
The weakness is obvious. A client who also wants to see GA4, Search Console, and Google Ads cannot see them there. You end up with a separate AI visibility deck and a separate performance report, and someone has to reconcile the story between them.
What a good native setup should give you:
- Per-client workspaces, so one client never sees another's data.
- Scheduled PDF reports, ideally white-labeled.
- Exports (CSV, Looker Studio connector, API) so you are not locked in.
- Custom dashboards where you choose and order the widgets, not a fixed template.
Promptwatch is a good example of the native approach done properly for agencies. It supports custom team dashboards, scheduled PDF reports to any inbox, and a Looker Studio connector from the Professional plan up, plus Excel and CSV exports and a REST API with an MCP server for the rest. Agency plans start at $199/month (Kick-off) with unlimited projects and seats, and white-label dashboards and client portals sit on Enterprise. Confirm current tiers at promptwatch.com/pricing. There is more on running this at scale in the GEO for agencies guide.
Other trackers with agency angles include Peec AI, Rankscale, Nightwatch and AgencyAnalytics' add-on; the AI rank tracking directory is a quick way to compare them. Whichever you use, the native dashboard is where you and your analysts live. The question is whether it is where the client lives.
Option 2: Looker Studio
Looker Studio (Google now brands the product page as Data Studio in places) is the default free choice, and for good reason. If a client's world is GA4, Google Ads, Search Console and YouTube, everything connects natively at no cost. Over 1,000 connectors exist in the marketplace for the rest.
The catch is everything around the canvas:
- No native white-label branding. Google's branding is visible.
- Scheduled email is capped. Per Google's support page, individual accounts get 200 recipients a day and 800 a month; Workspace accounts 500 and 3,000. Pro has no quotas.
- Multi-client management is a folder structure you maintain by hand.
- Many non-Google sources need a paid connector at agency volume. Third-party vendors list starting prices such as Supermetrics at $44/month billed annually, Coupler.io at $24 and Windsor.ai at $19, though prices change, so check their pages.
- Pro is about $9 per user per project per month if you need governance.
For AI visibility specifically, Looker Studio does not track anything. It only displays what you feed it. That means the GEO platform needs a connector, a scheduled export to Google Sheets or BigQuery, or an API pull. If your tool has an official Looker Studio connector, the setup is a couple of hours. If it does not, you are writing glue code or exporting CSVs monthly, and that is where "free" gets expensive in analyst time.
I like Looker Studio for the agency that has one strong analyst who enjoys building reports and a client base that is mostly Google-centric. I do not like it for an agency of fifteen account managers who each need to ship reports without a ticket to the data team.
Option 3: Whatagraph
Whatagraph is the most polished of the three. It is built for agencies that need white-label, cross-channel reports where SEO, PPC, social and now AI visibility sit in one branded document. Its Data Hub combines 60+ sources (other comparison articles quote 80+, so treat the count as approximate), with Blends and Source Groups to merge data and Custom Metrics so you define something like blended ROAS once.
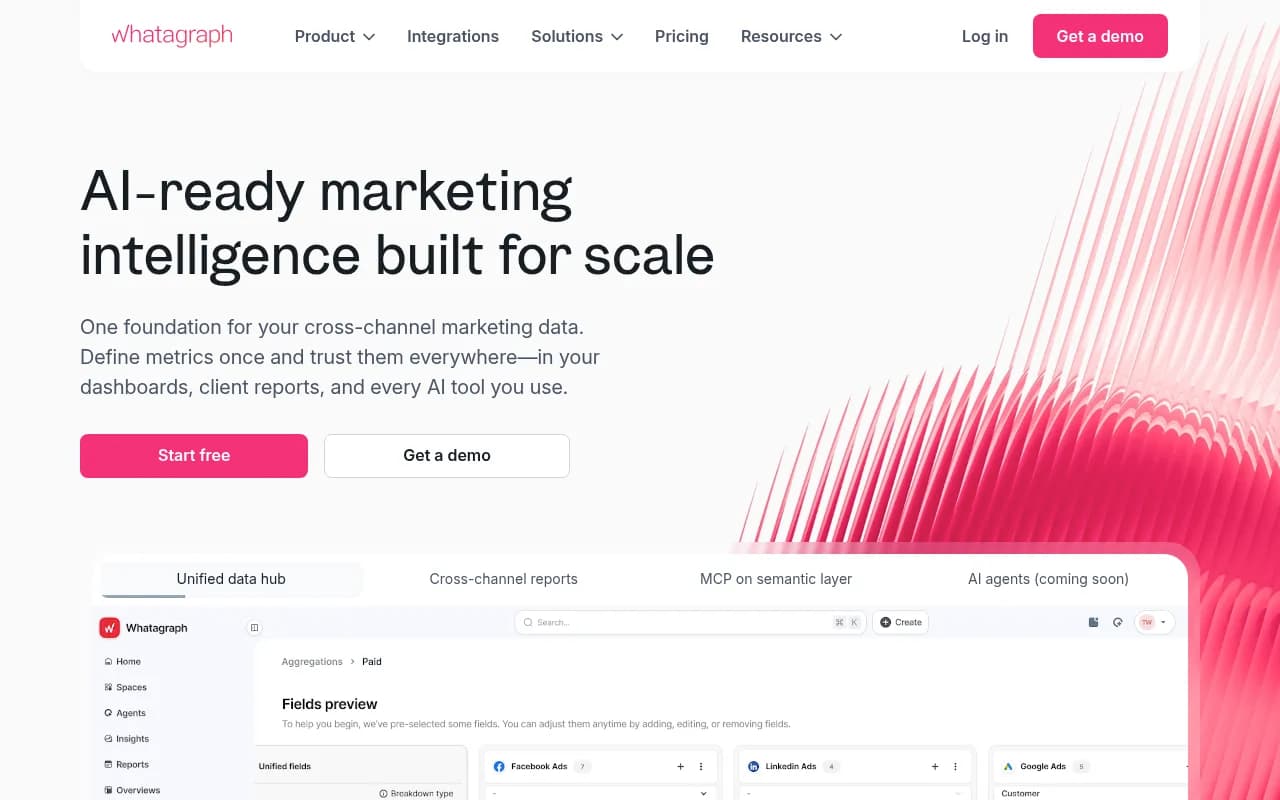
The AI angle is real. Whatagraph IQ generates reports from a plain-language prompt, IQ Chat answers questions about connected data, and IQ Agents plus an MCP server make account data available to assistants like Claude and ChatGPT. Reported agency results come from Whatagraph's own case studies: Maatwerk Online says it saves more than 100 reporting hours a month, and Dtch. Digitals credits standardized reporting with a 50% reduction in client churn. Both are vendor-published, so weigh them as such.
The pricing details that matter
This is where older comparison articles are stale. According to Whatagraph's pricing page:
- Max starts from $812/month billed annually, with 50 source credits (one credit equals one connected data account), unlimited users and reports, white-label reports, IQ Agents, and automated emails with PDF.
- Max does not include a custom report domain, transfer to BigQuery or Looker Studio, a public API, or premium integrations.
- Prime is custom-priced and adds premium integrations, IQ+ and the Looker Studio transfer. Custom report domain, BigQuery transfer, public API and SAML SSO are add-ons.
- Agent usage comes in Base, Mid and Heavy tiers. Base is included in every plan. "AI visibility" is listed only under Mid and Heavy, and the page does not give Mid or Heavy prices.
Two things follow. First, some roundups still describe Whatagraph as starting at $199 or $229 a month with full custom-domain white labeling. That is out of date for Max. Second, if native AI visibility monitoring inside Whatagraph is the reason you are buying, get a quote for the Mid tier before you commit. Its MCP documentation describes AI visibility monitors for ChatGPT, Gemini, Claude and Google AI Overviews, but I could not verify how deep that tracking goes versus a dedicated GEO platform. The safer pattern for most agencies is to treat Whatagraph as the presentation layer and bring in AI visibility data from a specialist tool.
Side-by-side comparison
| Native GEO dashboard | Looker Studio | Whatagraph | |
|---|---|---|---|
| Cost | Included in the GEO tool's plan | Free; Pro about $9/user/project/month; connectors extra | Max from $812/month billed annually; Prime custom |
| White-label | Varies; client portals often on enterprise tiers | None natively | Included on Max; custom domain only as a Prime add-on |
| Cross-channel data | AI visibility only (some add search data) | Strong for Google sources; others via paid connectors | Strong, 60+ sources with blends |
| AI visibility data | Native and most complete | Only what you pipe in | Listed in Mid/Heavy agent tiers; verify depth |
| Scheduling | Usually scheduled PDFs | Capped email quotas on free accounts | Automated email with PDF |
| Setup effort | Low | High, and ongoing | Medium |
| Best for | Analysts and AI-first retainers | Google-heavy clients, DIY teams | Larger agencies selling polished multi-channel reports |
What to actually put in the AI visibility report
The tool debate matters less than the content. AI answers vary from run to run, so a single screenshot of a chatbot recommending your client proves almost nothing. One r/DigitalMarketing commenter called that "screenshot theater" and argued for reporting the share of priority prompts where the client is recommended, plus share of voice against named competitors. That is one practitioner's view, not a standard, but it matches how I would do it.
A monthly note that holds up has these parts:
- A fixed prompt set agreed with the client. Do not swap prompts month to month, or the trend line means nothing.
- Mention rate by engine, from repeated runs, separate from citation rate (whether one of the client's pages is cited as a source). The citations vs mentions distinction trips up many clients.
- Share of voice against a fixed list of named competitors across the same prompts. See the definition in Share of Voice.
- Traffic and conversions from AI referrals, which is the number the client's finance person cares about. Attribution is getting harder, so read attributing AI traffic before promising anything.
- What you did and what you will do next. Published pages, fixes, planned content.
Report each engine against its own baseline
Do not compare raw citation counts across engines. Promptwatch's average sources per response data shows ChatGPT citing about 5 sources per web-search answer, while Google AI Overviews cites about 10 and Perplexity almost exactly 10 every day. A client seeing "3 citations on ChatGPT, 6 on AI Overviews" might think ChatGPT is the problem channel when each is roughly 60% of its engine's norm. The same dataset shows Copilot swinging from under 2 to nearly 17 sources within a few weeks, so judge it on monthly trends, not weekly snapshots.
Volatility is also a reason to explain dips in advance. Promptwatch Data found reddit.com's share of ChatGPT citations fell from roughly 4% to 0.5% on August 14, 2026, and ChatGPT's average citations per response dropped around the GPT-5.3 rollout. If a client's numbers fall in a month like that, an engine-wide change is a very different conversation from a content problem. Add a short "what changed in the engines" line to the report and you will save yourself some awkward calls.
Which setup fits which agency
Small agency, few clients, AI visibility as an add-on
Use the native dashboard and its scheduled PDF. Keep Looker Studio only if clients already live in it. Adding Whatagraph at $812+ a month for five clients is hard to justify.
Mid-size agency with Google-centric clients
GEO platform as system of record, a Looker Studio connector to bring AI visibility into the same report as GA4 and Search Console. Budget a day to build a template and clone it per client. Watch the email quotas if you schedule at volume.
Larger agency selling polished retainers
Whatagraph (or a comparable tool like AgencyAnalytics, DashThis or Swydo, though the last two list no native AI search tracking on their pages) as the client-facing layer, with the GEO platform feeding it. Confirm which AI visibility data can actually be pulled in before signing, and whether you need the Prime add-ons for a custom domain.
AI-first agency
If AI visibility is the retainer, the native dashboard is the product. Look for pitch projects, per-client workspaces, scheduled PDFs and an API. Agency plans at Promptwatch are built around that, and the Monks case study shows one agency using the gap reports to build client content roadmaps. For more options, the GEO software directory lists alternatives.
A practical hybrid workflow
Here is the setup I would build for a 10 to 20 client agency:
- Create one monitor per client market in the GEO platform, with a fixed prompt set signed off by the client.
- Schedule a monthly PDF from the native dashboard as the appendix. It is the source of truth if anyone questions a number.
- Connect the same metrics (mention rate, share of voice, citations, AI-referred sessions) into a single client report in Looker Studio or Whatagraph.
- Keep definitions in a one-page glossary the client receives once, not in every report.
- Review quarterly. If the report is not being read, cut widgets, not add them.
Agencies that want a second pair of hands on the strategy side can also bring in a specialist. 1001 SEO Media, which publishes this site, runs GEO and SEO retainers for brands and uses Promptwatch for its own AI visibility reporting.
Questions to ask before you buy anything
- Does the AI visibility data reach the client-facing report, or only the dashboard? Semrush, for example, lists white-label AI visibility reports without naming which plan delivers them.
- Is there a connector, API or export you can rely on without a developer?
- What happens to history if you switch tools?
- Is the pricing per client, per data source, or per seat? Per-source pricing hurts agencies with many accounts per client.
- Can you try it on a real client for a month before committing to annual billing?
Bottom line
Looker Studio is the cheapest way to get AI visibility next to Google data, if you have the time to build and maintain it. Whatagraph is the most polished client deliverable, but verify what its Mid and Heavy AI visibility tier actually includes and what it costs before you count on it. Native dashboards are the most accurate and the least work for the analyst, and they are where I would keep the data of record. For most agencies, the answer is native plus one client-facing layer, with a fixed prompt set and per-engine baselines doing more for client trust than any dashboard theme.
If you want to see what your own baseline looks like first, the free AI visibility report takes a few minutes and needs no login.