PostHog Review 2026
PostHog is an open-source product analytics platform built for engineers who want to understand user behavior, ship features faster, and build better products. Combines analytics, session replay, feature flags, A/B testing, and surveys in one developer-friendly platform with generous free tiers and
Key Takeaways:
- All-in-one platform: Combines product analytics, session replay, feature flags, A/B testing, and user surveys in a single tool — no need to stitch together multiple vendors
- Built for engineers: Developer-first approach with SQL access, API-first architecture, and deep technical documentation that respects how engineers actually work
- Open source foundation: Fully open-source core (MIT license) with 18,000+ GitHub stars, self-hosting option, and transparent development roadmap
- Generous free tier: 1 million events, 5,000 session replays, and 1 million feature flag requests per month free — enough for most early-stage startups to run indefinitely without paying
- Best for: Product engineers, technical founders, and engineering-led teams who want full control over their data and don't want to deal with sales calls or opaque pricing
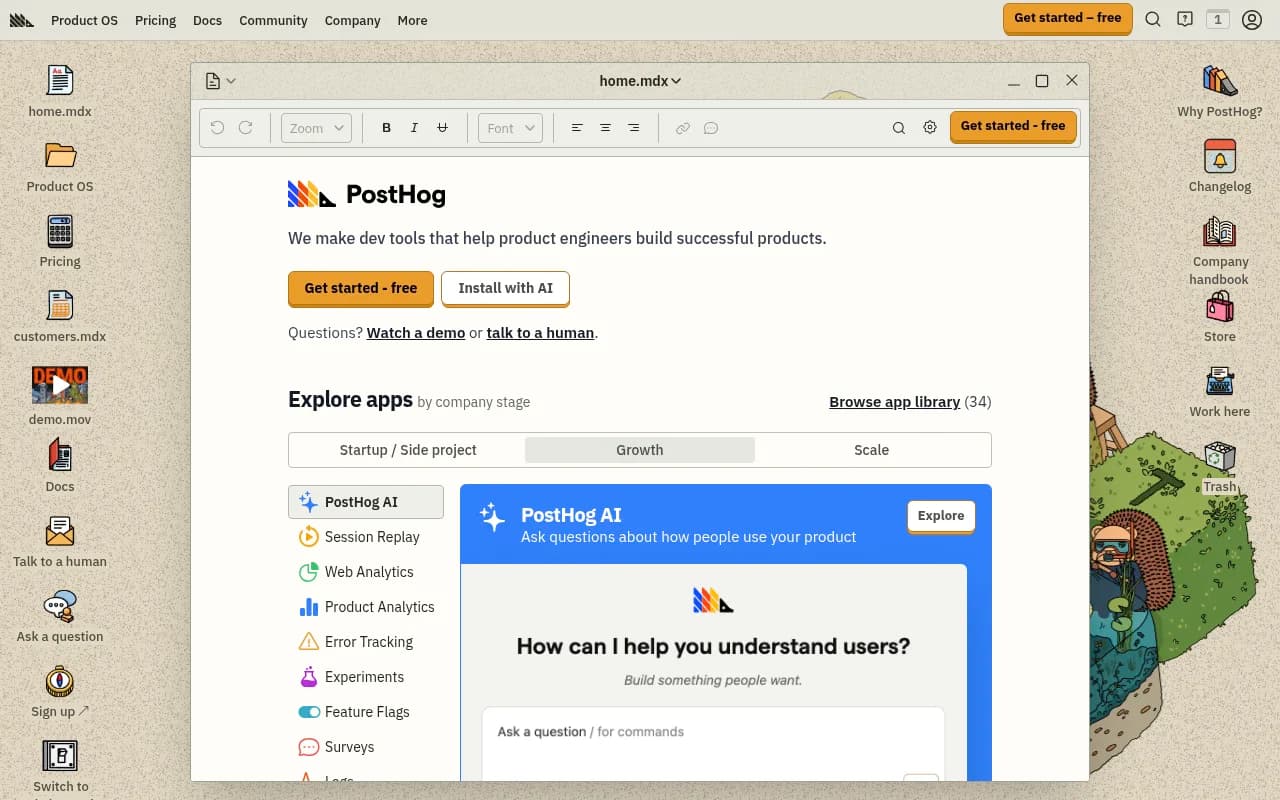
PostHog is what happens when engineers build product analytics for other engineers. Founded in 2020 by James Hawkins and Tim Glaser during Y Combinator's W20 batch, PostHog set out to solve a frustration both founders experienced repeatedly: product analytics tools were either too expensive, too limited, or required talking to sales just to see pricing. The result is a platform that combines product analytics, session replay, feature flags, A/B testing, and user surveys into one cohesive tool with transparent pricing and a fully open-source core.
Today PostHog is used by over 60,000 companies including Y Combinator startups, Phantom, Vendasta, and Hasura. The platform processes billions of events monthly and has raised over $27 million from investors including GV (Google Ventures) and Y Combinator. What makes PostHog different isn't just the feature set — it's the philosophy: give engineers the tools they need, get out of their way, and never hide pricing behind a sales call.
Product Analytics PostHog's analytics engine tracks user behavior across web and mobile apps with event-based tracking that captures everything from page views to custom events. The Trends tool shows how metrics change over time with breakdowns by user properties, cohorts, or any custom dimension you define. Funnels visualize conversion paths and show exactly where users drop off — you can break down each step by any property to understand why certain segments convert better than others. The Paths feature shows the actual routes users take through your product, surfacing unexpected navigation patterns you wouldn't find in a traditional funnel. User paths can be filtered by cohorts, properties, or specific events to understand how different user types behave.
Retention analysis shows how many users come back after their first visit, broken down by cohort or any property. Lifecycle charts categorize users as new, returning, resurrecting, or dormant to understand engagement patterns over time. Stickiness metrics show how often users perform key actions within a time period. The SQL query builder (HogQL) gives direct access to the underlying data warehouse for custom analysis that goes beyond the UI — write raw SQL queries against your event data and save them as insights. Dashboards combine multiple insights with filters, date ranges, and refresh schedules. You can share dashboards publicly or embed them in internal tools.
Session Replay Session replay records actual user sessions so you can watch exactly what users do in your product — mouse movements, clicks, scrolls, network requests, console logs, and DOM changes. Replays are automatically linked to analytics events, so when you see a drop-off in a funnel you can immediately watch sessions of users who dropped off to understand why. The replay player includes a timeline showing events, network activity, and console logs synchronized with the video. You can skip inactivity, adjust playback speed, and jump to specific events. Privacy controls let you mask sensitive data (text inputs, emails, credit cards) automatically or define custom masking rules. Replays can be filtered by user properties, events performed, console errors, rage clicks (rapid clicking indicating frustration), or custom conditions. The mobile replay SDK works on iOS and Android, capturing touch events and screen recordings.
Feature Flags Feature flags let you roll out features gradually, run experiments, or toggle functionality without deploying code. Flags can target specific users, cohorts, or percentages of your user base. Multivariate flags support A/B/n tests with multiple variants. The flag evaluation happens locally in your app (after initial fetch) so there's no latency hit on every request. Flags integrate with session replay — when you watch a session, you see which flags were active for that user. The experimentation framework runs statistical tests on flag variants to determine winning variations. You can set primary and secondary metrics, define minimum sample sizes, and get Bayesian probability estimates of which variant is better. Early access management uses flags to give beta users access to unreleased features. The API supports server-side, client-side, and mobile SDKs in 15+ languages including JavaScript, Python, Ruby, Go, PHP, Java, React Native, iOS, and Android.
A/B Testing & Experiments The experimentation suite runs statistical tests on feature flag variants to determine which version performs better. Define a primary metric (conversion rate, revenue, retention) and secondary metrics to watch for unintended effects. PostHog calculates sample size requirements, tracks significance as data comes in, and shows Bayesian probability that each variant is best. Experiments can run on any event or user property — not just page views or clicks. You can test pricing changes, onboarding flows, email copy, UI layouts, or algorithm variations. The results dashboard shows conversion rates, statistical significance, and confidence intervals for each variant. Experiments integrate with feature flags so you can gradually roll out the winning variant after the test concludes. Holdout groups let you keep a control group even after rolling out a winner to measure long-term effects.
Surveys In-app surveys collect qualitative feedback directly from users while they're using your product. Surveys can be triggered by specific events (e.g. after completing onboarding), shown to specific cohorts, or displayed randomly to a percentage of users. Question types include multiple choice, rating scales, open text, and NPS. Responses are linked to user profiles and session replays so you can see what the user was doing when they submitted feedback. Survey results appear in analytics dashboards alongside quantitative data. You can correlate survey responses with user behavior — for example, see if users who rate a feature highly also use it more frequently. Surveys support custom styling to match your brand and can be embedded in your app or sent via link.
Data Warehouse & Integrations PostHog's data warehouse lets you import data from external sources (Stripe, Salesforce, Zendesk, etc.) and join it with product analytics data for unified analysis. Query across product events and CRM data in the same SQL query. The CDP (Customer Data Platform) syncs PostHog data to other tools — send cohorts to marketing platforms, trigger webhooks on specific events, or export data to data warehouses like Snowflake, BigQuery, or Redshift. Pre-built integrations include Segment, Rudderstack, Zapier, Slack, Discord, and 50+ other tools. The API supports both ingestion (sending events to PostHog) and querying (pulling data out). Webhooks trigger on specific events or user actions. The Toolbar is a browser extension that lets non-technical team members create events, view heatmaps, and launch surveys without touching code.
Who Is It For PostHog is built for product engineers and engineering-led teams who want full control over their analytics stack without vendor lock-in. Early-stage startups (pre-Series A) are the sweet spot — the generous free tier (1 million events/month) means most can run indefinitely without paying, and the all-in-one approach eliminates the need to stitch together Mixpanel + Amplitude + LaunchDarkly + FullStory. Technical founders who want to self-host their analytics (for compliance, data residency, or cost reasons) can deploy PostHog on their own infrastructure. Mid-size product teams (10-50 engineers) benefit from the unified platform — no more context switching between tools or reconciling data across systems. Developer tool companies and API-first products use PostHog because it speaks their language: SQL access, API-first design, and documentation that assumes technical competence.
PostHog is NOT ideal for large enterprises with complex procurement processes (no sales team to navigate your approval chain), non-technical marketing teams who need point-and-click simplicity (the UI assumes some technical knowledge), or companies that need white-glove onboarding and dedicated support (support is community-first with paid plans getting priority). If you need advanced marketing attribution, multi-touch attribution modeling, or deep advertising integrations, dedicated marketing analytics tools like Google Analytics 4 or Adobe Analytics are better fits.
Integrations & Ecosystem PostHog integrates with 50+ tools via native connectors and webhooks. Data sources include Segment, Rudderstack, Snowplow, and custom event APIs. Export destinations include Slack (send alerts on metric changes), Discord (notify channels of feature flag changes), Zapier (trigger workflows), Salesforce (sync user data), HubSpot (update contact properties), and data warehouses (Snowflake, BigQuery, Redshift, S3). The Sentry integration links errors to session replays and user profiles. The Stripe integration imports revenue data for cohort analysis and LTV calculations. GitHub integration shows which code changes correlate with metric changes. The API supports REST and GraphQL with client libraries in JavaScript, Python, Ruby, Go, PHP, Java, Node.js, React, React Native, iOS, Android, Flutter, and Elixir. The Toolbar browser extension works in Chrome, Firefox, and Edge for no-code event creation and heatmap viewing. Self-hosted deployments support Docker, Kubernetes, AWS, GCP, and Azure with Terraform templates and Helm charts.
Pricing & Value PostHog uses transparent usage-based pricing with generous free tiers on every product. Product Analytics: 1 million events free per month, then $0.00031 per event ($310 per million events). Session Replay: 5,000 recordings free per month, then $0.005 per recording. Feature Flags: 1 million requests free per month, then $0.0001 per request. Surveys: 250 responses free per month, then $0.20 per response. A/B Testing: included with Product Analytics pricing. You only pay for what you use above the free tier, and you can set billing limits to prevent surprise charges. A typical early-stage startup tracking 500K events/month with 2K session replays and 100K feature flag requests pays $0 — well within free tiers. A growth-stage company tracking 10 million events, 50K replays, and 5 million flag requests pays roughly $3,100/month for analytics + $225 for replays + $400 for flags = $3,725/month total. Compare this to Amplitude (starts at $995/month for 10M events, no replay), Mixpanel ($899/month for 10M events, no replay), FullStory ($199/month for 5K sessions but limited analytics), and LaunchDarkly ($10/seat/month minimum, usage fees on top). PostHog's all-in-one pricing is typically 40-60% cheaper than buying separate tools. Self-hosting is free (open-source MIT license) but you pay for infrastructure and maintenance. Annual billing gets 20% off. No contracts, cancel anytime.
Strengths & Limitations
Strengths: The all-in-one approach eliminates tool sprawl — one platform for analytics, replay, flags, experiments, and surveys means no data silos or integration headaches. The generous free tier lets startups run for years without paying, and transparent pricing means no sales calls or surprise bills. Open-source core (18K+ GitHub stars) provides full transparency, self-hosting option, and community-driven development. SQL access (HogQL) gives engineers unlimited flexibility for custom analysis. Session replay linked to analytics events makes debugging and understanding user behavior dramatically faster. Developer-first documentation and API-first design respect how engineers actually work.
Limitations: The UI assumes technical competence — non-technical marketers may find it less intuitive than Amplitude or Mixpanel. No dedicated customer success team or white-glove onboarding (support is community-first with paid priority). Marketing attribution and advertising integrations are basic compared to Google Analytics 4 or Adobe Analytics. Self-hosting requires DevOps expertise and infrastructure management. Mobile SDKs are less mature than web SDKs (though improving rapidly). The data warehouse feature is newer and less battle-tested than dedicated tools like Segment or Fivetran.
Bottom Line PostHog is the best choice for engineering-led teams who want full-stack product analytics without vendor lock-in, sales calls, or surprise pricing. If you're a technical founder, product engineer, or developer tool company that values transparency, control, and generous free tiers, PostHog delivers everything you need in one platform. Best use case: Early to mid-stage startups that want to understand user behavior, ship features confidently, and build better products without breaking the bank or stitching together five different tools.
Tags:
Frequently asked questions
What is PostHog and what does it do?
Is PostHog free to use?
Who is PostHog best for?
Can you self-host PostHog?
What features does PostHog include?
How much does PostHog cost after the free tier?
Is PostHog open source?
What companies use PostHog?
Similar and alternative tools to PostHog