Key takeaways
- AI share of voice is the percentage of AI answers for a defined prompt set that mention your brand, compared with the brands you actually lose deals to.
- Dev tools are cited differently from other software: docs, GitHub, and help centers earn more citations than review sites, so your benchmark has to include those sources.
- Published benchmarks (8-15% emerging, 15-25% competitive, 25%+ strong) come from vendor blogs, so use them as rough anchors. Your trend against named competitors matters more.
- One prompt tells you almost nothing. Plan on 50 to 200 prompts, split by intent, and run them on several engines.
- Track position and description, not just presence. Mentions without citations usually point to a content or crawlability problem.
What AI share of voice means for a dev tool
The simplest definition: run a fixed set of category prompts across AI engines, count how many responses mention your brand, divide by total responses, multiply by 100. If your CI platform shows up in 28 of 100 answers about CI tooling, your AI SOV is 28%.
Semrush uses a slightly different version: your mentions divided by total mentions across all brands in the category. The two numbers aren't interchangeable. The first is a coverage rate (a response can mention five brands and all five get credit). The second is a true slice of a pie that sums to 100%. Pick one, write it down, and never switch mid-quarter.
Why does this matter for developer tools specifically? Because the buyer journey has moved. Developers ask ChatGPT "best feature flag service for a Node monorepo" and get a synthesized answer. There is no position 1 on a results page. Either you're in the answer or you aren't.
Why dev tool benchmarks look small
Here is the thing nobody tells you about benchmarking in software: the citation pool is enormous. In Promptwatch Data's software report (organic software prompts in ChatGPT, Sep 28 to Oct 4, 2026), the top domain, GitHub, earned only 1.2% of all software citations. learn.microsoft.com got 0.98%, G2 0.73%, AWS docs 0.41%, Google Cloud docs 0.35%, Gartner 0.34%, Capterra 0.32%, Intercom 0.28% and Zapier 0.24%.
Those are citation shares against the whole software category, so any single brand's slice is thin. A long tail does that.
The source-type split is more useful for planning:
| Source type | Share of software citations |
|---|---|
| Docs and help centers | 2.64% |
| Vendor sites | 2.01% |
| Review sites and analysts (G2, Gartner, Capterra, Software Advice) | 1.57% |
| GitHub | 1.2% |
| App stores | 0.47% |
Docs and vendor sites together earn 4.65%, roughly 3x the share of review sites and analysts. For a dev tool, that means your documentation is a competitive asset, not an afterthought. If your docs sit behind a login or render only in client-side JavaScript, you are probably losing share to a competitor whose docs are plain HTML.
Step 1: Choose your competitive set
Start with three to five competitors. Not the ten you read about on analyst reports, the ones that come up in sales calls. Add one adjacent category too (for example, a hyperscaler's built-in service), because AI answers often recommend "just use the native option."
Split them into three groups:
- Direct competitors you lose deals to
- Category leaders you want to catch
- Open-source or native alternatives that AI recommends as a default
Do not forget the open-source one. In dev tools, a GitHub repo with 40k stars can out-mention a funded vendor in ChatGPT, and it will never show up in your CRM's lost-deal reasons.
Step 2: Build a prompt set that reflects real buying
This is where most benchmarking goes wrong. Teams write 20 prompts that all look like "best [category] tools" and call it a day.
Use three prompt types, because they behave differently:
- Organic discovery: "best API gateway for microservices on Kubernetes"
- Competitor comparison: "Datadog vs Grafana for small teams"
- Brand-specific: "is [your tool] good for monorepos"
Promptwatch's unique-domains report (Sep 28 to Oct 4, 2026) shows why the split matters. For organic prompts, 52.5% of ChatGPT responses cite 10 or more domains. For competitor comparison prompts it is 49.1%. For brand-specific prompts it drops to 21.3%, with 5 domains the most common count. Across all prompts, 47.6% of responses cite 10 or more domains and only 6% cite three or fewer.
So expect to share every organic answer with a crowd. And on brand-specific prompts, fewer sources shape what the model says about you, which makes those pages easier to fix.
How many prompts? Explorium's guide suggests the marginal signal per prompt falls after about 200, which matches my experience. Fifty well-chosen prompts beat 500 lazy ones. Weight them by the stage of the funnel you care about: a competitor with 40% overall share but 15% on your bottom-funnel comparison prompts is not the threat the headline number suggests.
Add persona and use-case variants. "Best observability tool for a startup with three engineers" and "for a regulated enterprise" can produce different winners.
Step 3: Run across engines, then weight them
ChatGPT, Gemini, Perplexity, Google AI Overviews, Google AI Mode, Claude and Copilot do not agree with each other. Siftly's execution plan recommends weighting engines by how much of your audience's AI usage each one represents, so a strong score on a niche engine doesn't inflate your average. For developers, that weighting should include coding agents too. Developers increasingly ask Claude Code or Codex which SDK to use, and those answers never show up in a browser-based test.
A simple approach: report SOV per engine first, then a blended number with weights you can defend. Use your own referral data to set weights if you have it.
Step 4: Read benchmarks without fooling yourself
The commonly quoted B2B software tiers, attributed by Explorium to Nightwatch and OptimizeGEO, look like this:
| AI SOV | Interpretation |
|---|---|
| Below 8% | Citation gap, largely absent |
| 8-15% | Emerging |
| 15-25% | Competitive |
| Above 25% | Strong |
| Above 40% | Category-dominant |
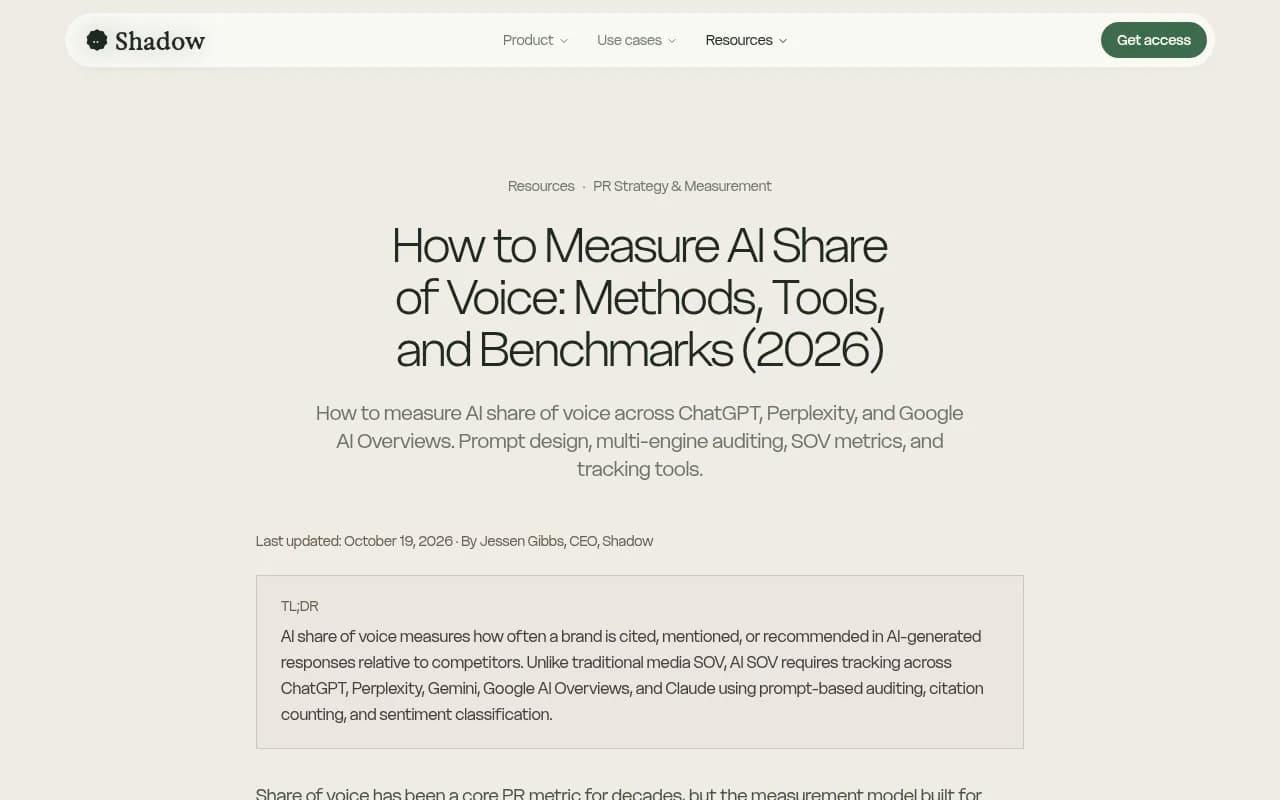
OptimizeGEO's own FAQ offers a slightly different cut (under 15% is a gap, 25-40% competitive, rarely above 60%). Shadow publishes a table with leader ranges of 10-20% in broad consumer categories with 50+ competitors. These disagree with each other, and all of them come from vendor blogs, not independent studies. Treat them as anchors for a first conversation, not as targets.
A fairer approach: your category's leader sets the ceiling. If the top brand sits at 22% on your prompt set, reaching 12% is a genuine win even though a generic table calls it "emerging." Aim for steady movement of one or two points per measurement cycle rather than a leap.
Also expect size bias. One arXiv paper cited by Siftly found household names appearing in 73% of relevant answers on their first tracking run, against 11% for niche brands. If you're a smaller dev tool, your first number will probably be ugly. That is a baseline, not a verdict.
Step 5: Go beyond the percentage
Presence is the crudest signal. Track four more:
- Position within the answer. Being listed first in a recommendation is not the same as the fifth bullet.
- Description. What does the model say about you? "Powerful but complex" versus "best for small teams" changes conversion.
- Citation versus mention. If the model names you but cites a competitor's blog or a review site, your own pages aren't doing the work.
- Who is cited next to you. Promptwatch's report recommends checking which competitors appear in the same responses as you, and running brand-specific prompts on competitors to see which sources shape how ChatGPT describes them.
Read together, these point to the real problem. Low share with good descriptions is a coverage problem. Good share with weak sentiment is a reputation problem. Mentions with no self-citations usually mean a crawlability or content gap.
Tools for tracking dev tool SOV
You can do this by hand in a spreadsheet for a month. After that the maintenance burden wins. The tools split into dashboards that report a score and platforms that help you act on it.
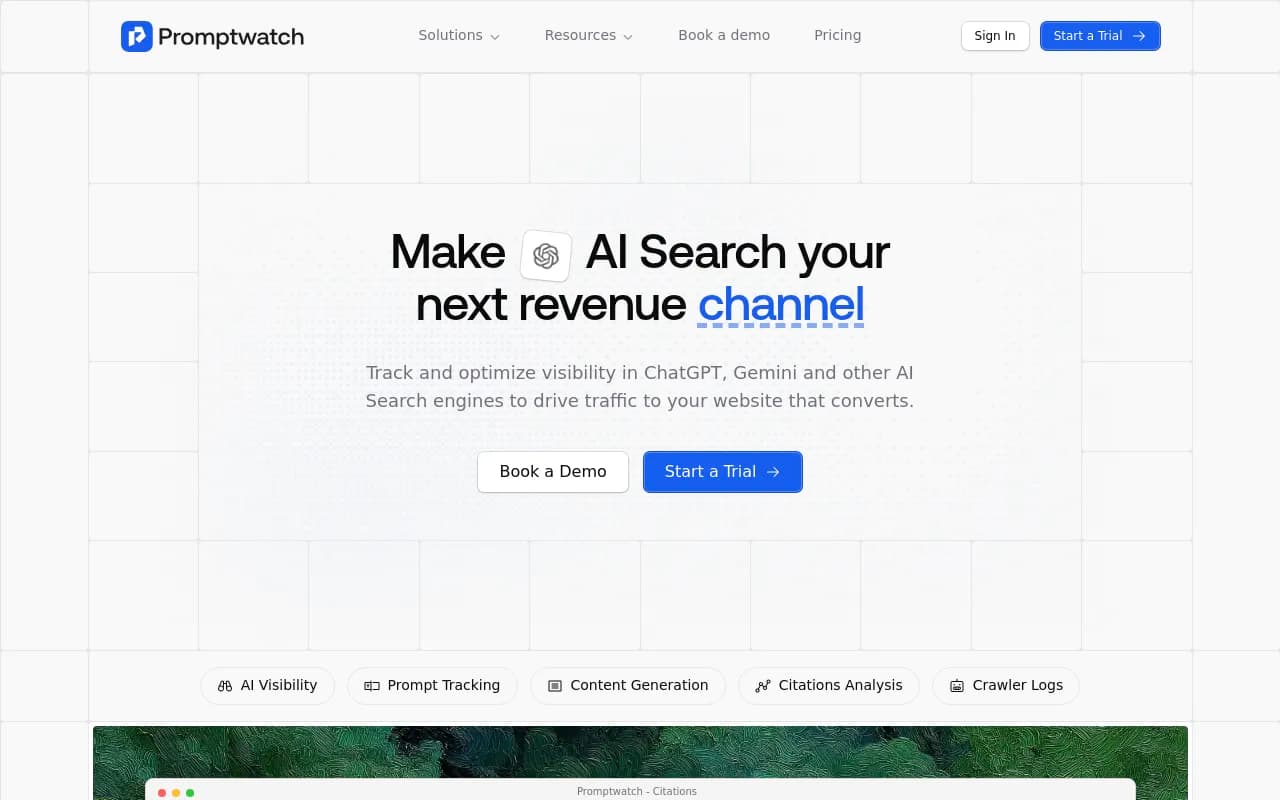
Promptwatch is the one I would start with if you want the loop closed. It tracks prompts across the real interfaces of ChatGPT, Gemini, Perplexity, Google AI Overviews and others, including coding agents like Codex and Claude Code, which matters if developers are your buyers. It also shows Share of Voice, position, sentiment and the claims AI makes about you, then connects that to IP-verified AI crawler logs so you can tell whether a docs page is unread or just uncited. There is a 7-day free trial on monthly plans, and pricing is on promptwatch.com/pricing.
Other options worth knowing:
Semrush has an AI Visibility Toolkit that shows share of voice next to named competitors, switchable by engine such as ChatGPT, Google AI Mode or Perplexity. It is convenient if you already live in Semrush.
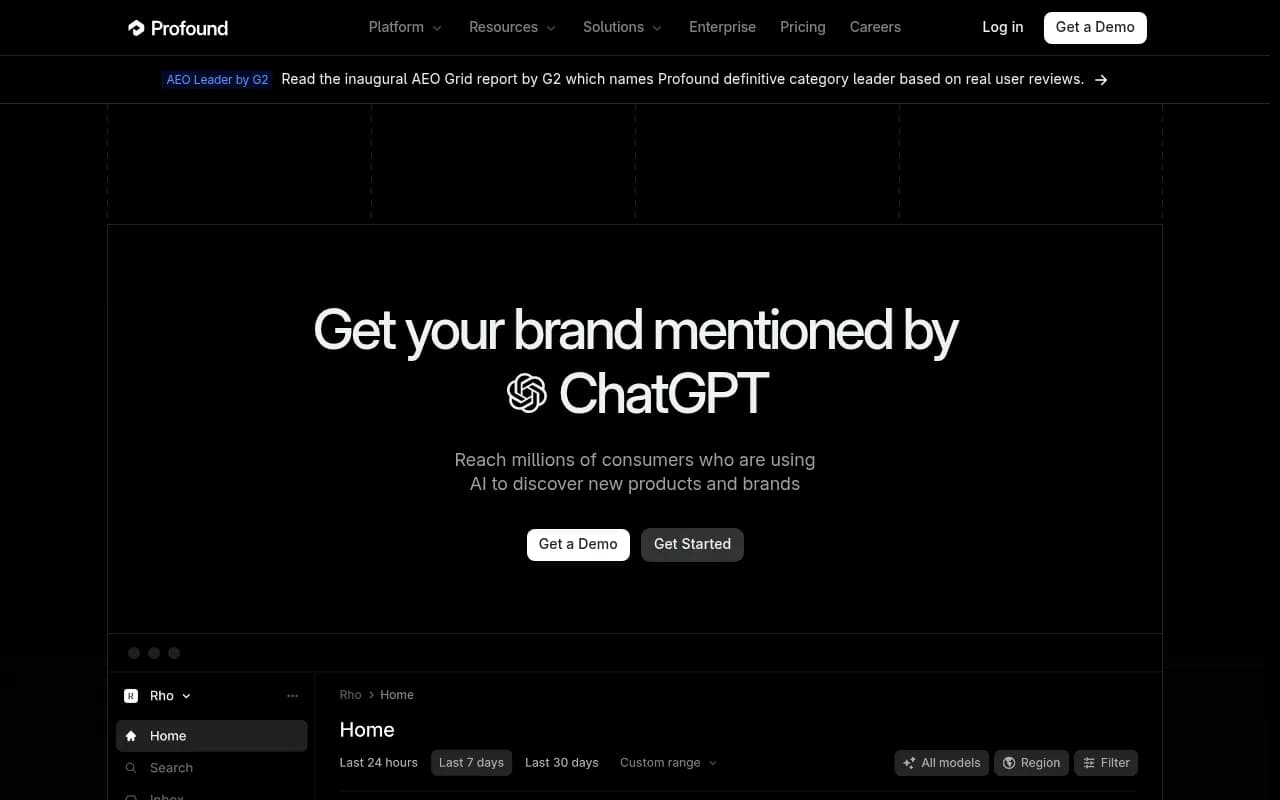
Profound targets enterprise teams tracking a wide set of engines.
Profound
Otterly.AI is a lighter monitoring option for brand mentions across ChatGPT, Perplexity and AI Overviews.
Otterly.AI

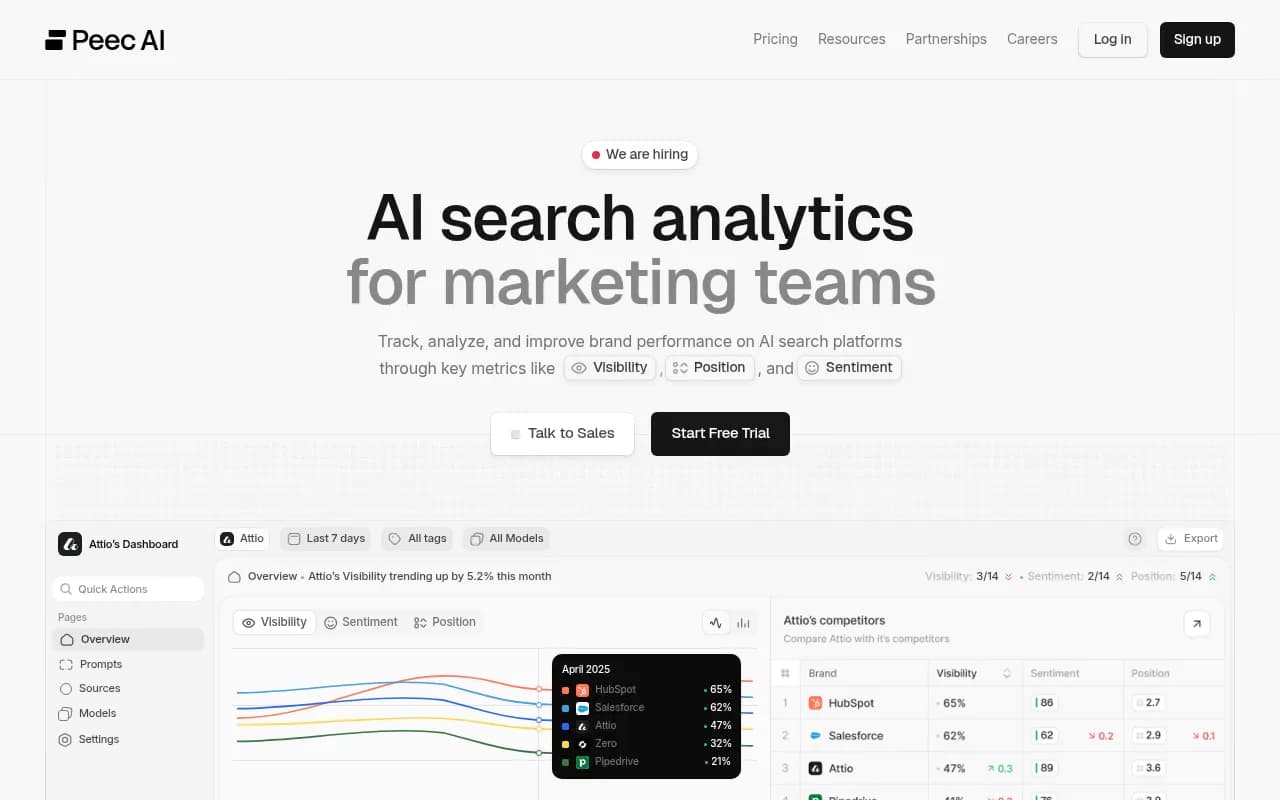
Peec AI covers AI search visibility tracking for marketing teams.
LLM Pulse tracks visibility across ChatGPT, Perplexity and more, and publishes its own share-of-voice benchmarks.
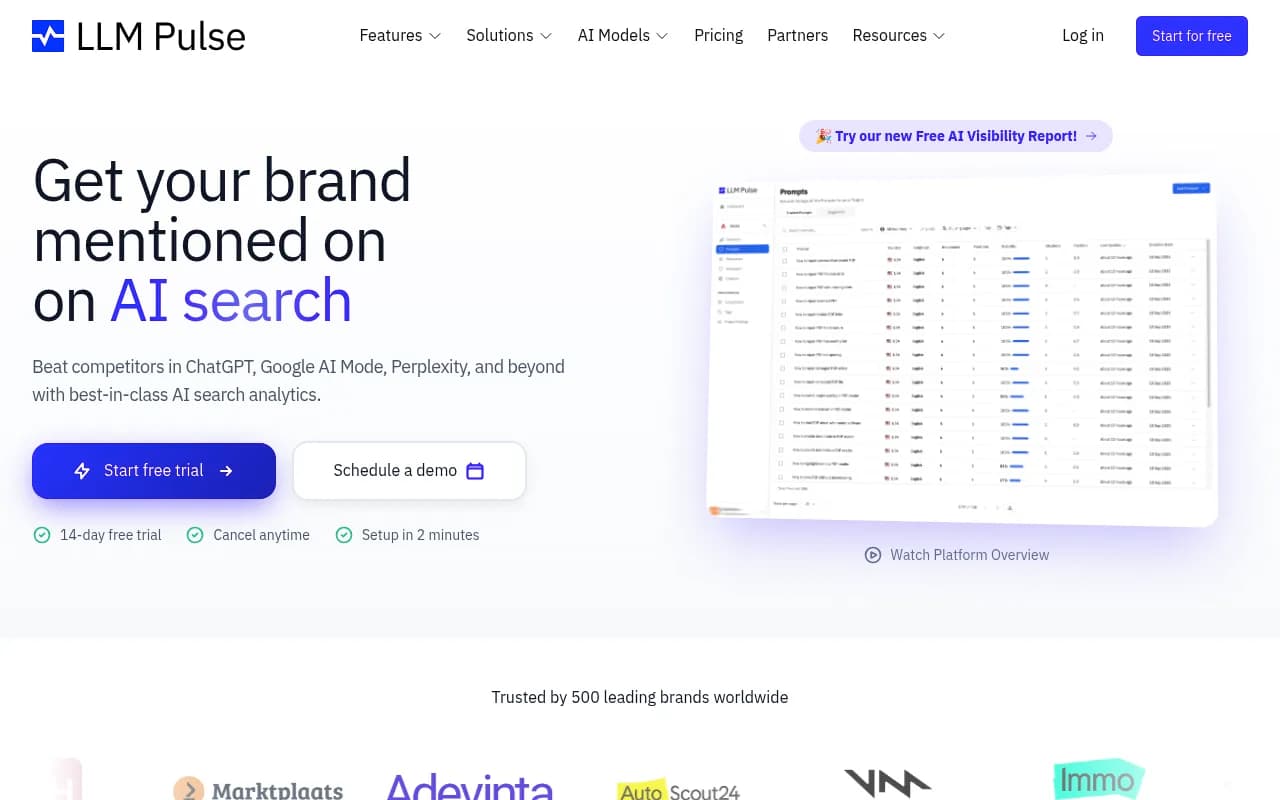
| Tool | Competitor benchmarking | Goes beyond monitoring | Best for |
|---|---|---|---|
| Promptwatch | Yes, with heatmaps and Share of Voice | Content gaps, content agent, crawler logs, traffic | Teams that want to fix gaps, not just see them |
| Semrush | Yes, per engine | Part of a broader SEO suite | Existing Semrush users |
| Profound | Yes | Enterprise monitoring focus | Large budgets |
| Otterly.AI | Basic | Limited | Small teams starting out |
| Peec AI | Yes | Limited | Marketing teams that need quick dashboards |
| LLM Pulse | Yes | Limited | Monitoring plus published benchmarks |
For more options, the GEO software directory at bestgeosoftware.com lists dozens of trackers by feature.
Step 6: Turn gaps into work
A benchmark that doesn't change what you publish is a vanity report. Four moves tend to pay off for dev tools:
- Keep docs crawlable. Plain HTML, no login wall, clear headings. Promptwatch's software report recommends keeping docs and help pages crawlable, a public GitHub presence, and current G2 and Capterra profiles.
- Publish your own comparison pages. If a third-party "X vs Y" page describes you wrongly, that description becomes the model's description. Write an honest comparison yourself, and correct the review profiles.
- Run answer-gap audits. List the prompts where competitors appear and you don't, then check which sources the AI cites for them. Often it is one comparison article or one subreddit thread.
- Check crawler access. Before blaming content, confirm AI bots can actually read your site. Promptwatch's free Agentic Readiness Check is a quick first test.
A measurement cadence that works
Weekly is too noisy for most teams. Monthly is the minimum, and AI SOV can shift within days after a competitor ships a big content push or gets press, so check the trend line between formal reviews.
A reasonable rhythm:
- Monthly: SOV by engine, by prompt type, versus each named competitor.
- Quarterly: refresh the prompt set. Products and buyer language change.
- After any launch or major content release: a one-off check on the prompts it should affect.
- Always: annotate your chart with what you published, so you can link movement to cause.
Keep your methodology document short and boring. Prompt list, engines, weights, formula, date. When the number moves, you want to know it moved because of the market and not because someone tweaked the prompts.
Common mistakes
One prompt, one run. AI answers vary. Run each prompt multiple times or across days and average.
Counting only your brand. If you track just yourself, you can't tell whether a 3-point rise is you improving or the category shrinking.
Ignoring sentiment. A mention that says "avoid this for large teams" is worse than silence.
Treating vendor benchmarks as truth. Shadow, OptimizeGEO and LLMpulse all sell something. Their ranges are useful and not independent.
Skipping the long tail. Because shares are spread so thin in software, small gains on many prompts beat a big push on one.
Where to start this week
Pick five competitors, write 50 prompts across discovery, comparison and brand-specific types, and run them on at least three engines. Record presence, position and description in a spreadsheet or a tracker. Then pick the three prompts where a competitor beats you and look at which pages the AI cited. That list is your content roadmap for the next month.
If you'd rather have a team own this end to end, 1001 SEO Media runs GEO programs for brands and uses Promptwatch for the measurement side. Either way, the first benchmark is the hard part. After that you just compare it to the next one.