Key takeaways
- Comparisons are 5.9% of ChatGPT citations across all prompts and 7.9% for commercial prompts like "best CRM for small businesses" (Promptwatch Data, Sep 28 to Oct 4, 2026).
- They last. Comparison pages were still cited 72% of the time after 30 days and 63% after 60 days, far better than news.
- Lead with a verdict, use real tables, state who each tool is for, and keep every price and feature current.
- Fair, factual treatment of competitors beats trash talk. Models and buyers both punish pages that read like ads.
- For dev tools, comparison pages are only one source. Docs, GitHub, and G2 or Capterra profiles earn citations too, so they need to agree with each other.
Why comparison pages matter for dev tools
When a developer asks ChatGPT "Postgres hosting: Supabase vs Neon" or "best feature flag tool for a small team", the model runs several searches, pulls pages, and stitches an answer. A page that already does the comparing is easy material to cite.
The numbers are modest but real. According to Promptwatch's data on which content types ChatGPT cites (Sep 28 to Oct 4, 2026), comparisons earn 5.9% of citations across all prompts. Product pages lead at 22.4%, landing pages follow at 16.8%, and listicles get 13.6%. Comparisons rise to 7.9% on commercial prompts, which is where buying decisions happen. On those prompts, product pages, landing pages, listicles, and comparisons together make up almost 70% of citations.
So a comparison page is not a magic bullet. It is one of four formats that dominate commercial answers, and it is the one you can write in an afternoon about a specific rival.
There is a second reason to care, and it is about durability. Promptwatch's content half-life study tracked pages ChatGPT cited on July 6, 2026 through October 4. Comparison pages were still cited 72% of the time after 30 days and 63% after 60. Product pages, reviews, and how-tos sat around 55% after 60 days. News fell to 41%, and half of news pages were gone by day 36. A comparison page is closer to an asset than a post.
What the data does and doesn't say
I want to be straight about the limits. Promptwatch's figures cover all topics. I found no data specific to dev-tool "X vs Y" pages, so don't read 5.9% as a promise for your niche.
There is also advice floating around that I couldn't verify. A CXL reel from October 2025 claims two- and three-way comparisons beat generic listicles, and that adding a date like "June 2025" helps because models weigh freshness. It is plausible and cheap to try, but it comes from an Instagram clip, not a dataset. Treat it as a hypothesis and test it.
What the first-party data does support is simple: comparisons are cited, they persist, and accuracy matters. Build on that.
Start with a verdict, not a preamble
The most repeated advice across the sources I read, including Duda's guide, is to answer first. Open with a TL;DR that gives a clear conclusion. A model scanning your page for a quotable answer should hit one in the first 100 words.
For a dev tool, a good verdict names the decision rule. Something like:
Choose Tool A if you run a small team on a single region and want predictable pricing. Choose Tool B if you need multi-region replication or a self-hosted option. Both support Postgres 16 and have official SDKs for TypeScript and Python.
That is specific, honest, and quotable. Compare it with "Tool A is the best choice for modern teams." The second one tells a model nothing it can reuse.
Name the audience
Generic comparisons are weak. "Tool A vs Tool B" is vague, while "Tool A vs Tool B for a 5-person startup on AWS" gives the model a scenario to match against the prompt. The CXL clip makes the same point about ICP-specific comparisons (unverified, but it matches how developers actually phrase questions).
Structure the page so it can be extracted
Models don't read like humans. They pull chunks. Make each chunk self-contained.
Recommended page skeleton
- One-paragraph verdict with who should pick which tool
- A comparison table of the criteria that actually decide the purchase
- Short sections per criterion, each opening with its own conclusion
- Pricing, with the date you checked it
- When to choose each tool
- Migration notes, if switching is realistic
- FAQ with real developer questions
- Last updated date and a named author
The table does the heavy lifting
A table is the easiest thing for a model to lift. Keep rows factual and checkable. Here is the sort of table that works for a hypothetical feature flag comparison:
| Criteria | Tool A | Tool B |
|---|---|---|
| Free tier | 1,000 MAU | 5 seats, unlimited flags |
| Paid starts at | $25/mo | $20/seat/mo |
| Self-hosting | No | Yes, Docker and Helm |
| SDKs | 12 languages | 25+ languages |
| Audit log | Paid plans only | All plans |
| Best for | Small teams, simple rollouts | Larger teams, compliance needs |
Every cell should be something a reader could verify in under a minute. If it can't be verified, cut it or soften it.
Use criteria developers actually ask about
Pull criteria from places where your buyers already compare: GitHub issues, Reddit threads, support tickets, sales calls. Typical dev tool criteria are pricing at scale, rate limits, SDK quality, self-hosting, latency, security certifications, data residency, and lock-in. Skip vague rows like "ease of use" unless you define them.
Write fairly, because it gets quoted
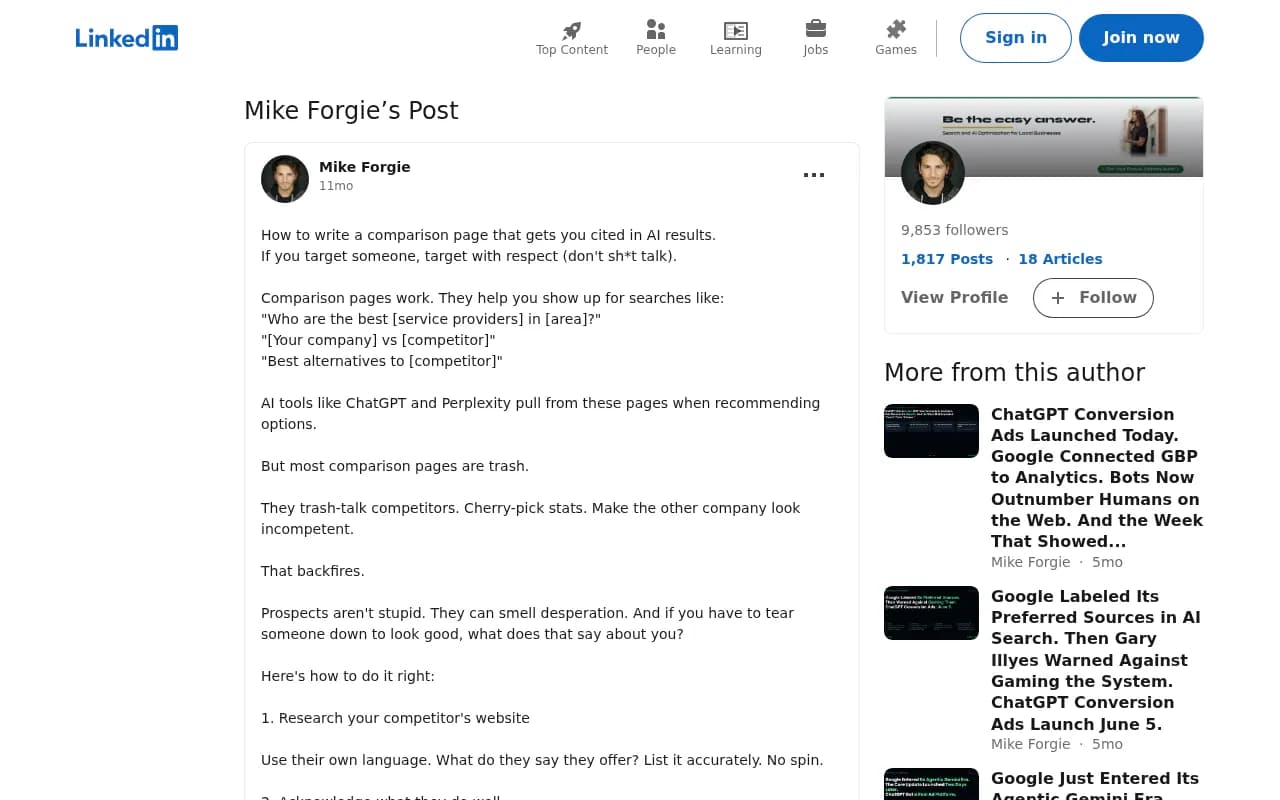
Mike Forgie's LinkedIn post (Dec 2025) is opinion, not research, but it is right about tone. His advice: use the competitor's own language, state what they do well, show what you add, and let the reader decide.
There is a practical angle for dev tools. Developers will fact-check you in minutes. If your table says a rival lacks SSO and their pricing page says otherwise, you've lost the reader and probably the citation. Similarweb's AI citation guide recommends comparison pages with objective criteria, pros and cons, and when to use each product. That framing works because it reads as advice rather than advertising.
A few habits that help:
- Say where the competitor wins. One honest paragraph buys credibility for the rest.
- Cite their docs or pricing page for each claim about them, with the date checked.
- Avoid superlatives. "Faster" needs a benchmark, a method, and a link.
- Don't cherry-pick. If your benchmark favors you only at one payload size, say so.
Prove your claims
The xSeek and Branviz guides both stress verifiable claims and proof links, and it matches how citation selection seems to work: pages with checkable specifics are safer to quote. For a dev tool, proof looks like:
- A link to your public benchmark repo, with the commit and hardware noted
- Links to the relevant sections of each product's docs
- A changelog reference for features that shipped recently
- Screenshots of pricing pages with the capture date
Methodology matters more than people think. A short "How we compared" box stating versions tested, date, and region turns an opinion into a source.
Keep it current
The half-life data has a catch worth reading carefully. Comparison pages, landing pages, docs, and listicles only cross 50% in the final week of the study window, and that is partly because every line drops as the window ends. Their real half-life is likely near or beyond 90 days. Good news, but it assumes the page stays correct.
Promptwatch's own takeaway is blunt: comparison pages and listicles keep more than 60% of their citations after two months, so keep prices, features, and positioning accurate. Dev tools change fast. A stale "Tool B has no free tier" line can survive in a model's answer long after Tool B launched one.
A workable maintenance routine:
- Put a visible "Last verified" date on the page and actually update it.
- Set up change monitoring on competitor pricing and docs pages. Tools like Visualping or Page Modified do this.
- Review every comparison page quarterly, and after any major release from either side.
- Log changes at the bottom of the page so the history is visible.
Make the rest of your footprint agree
A comparison page doesn't work alone. Promptwatch's software citation data (Sep 28 to Oct 4, 2026) shows where ChatGPT looks for software prompts. GitHub leads at 1.2%, then learn.microsoft.com at 0.98% and G2 at 0.73%, followed by AWS docs, Google Cloud docs, Gartner, Capterra, Intercom, and Zapier. Docs and help centers earn 2.64% by source type and vendor sites 2.01%, while review sites and analysts get 1.57%. Vendor sites and docs together earn about three times as much as review sites and analysts.
Translated for a dev tool team:
- Keep docs crawlable, not hidden behind JavaScript or login walls.
- Keep a public GitHub presence with a clear README that states what the tool is for.
- Complete your G2 and Capterra profiles so third parties describe you the way you describe yourself.
- Make sure pricing and feature claims are the same everywhere. Conflicting facts across pages are how models end up wrong about you.
Also make your product page easy to compare. Promptwatch's content-type report recommends clear pricing, specs, and who the product is for, and getting listed in the "best of" roundups ChatGPT cites alongside publishing your own comparisons.
Check crawler access before writing anything
The best comparison page is worthless if AI crawlers can't read it. Confirm robots.txt isn't blocking GPTBot, OAI-SearchBot, ClaudeBot, or PerplexityBot, that the content renders without client-side JavaScript, and that the page is in your sitemap. If your site is a JS-heavy app, a prerendering service such as Prerender.io can help.
Schema markup is mentioned in several of the guides I read (SearchFit, Branviz). It is cheap to add FAQ and Article markup with a real author and modified date, though I'd treat it as hygiene rather than a lever.
Measure whether it works
You need to see which prompts mention you, which pages get cited, and whether AI crawlers fetch your comparison page at all. A few ways to do it:
- Run your target prompts manually in ChatGPT, Perplexity, and Google AI Mode each month and log who gets cited.
- Check server logs for AI bot hits on the comparison URLs.
- Watch referral traffic from AI engines in your analytics.
- Use a visibility platform to automate it.
Promptwatch covers this loop for teams that don't want to do it by hand. It tracks prompts in the real interfaces of ChatGPT, Google AI Overviews, Perplexity and others, shows which of your pages get cited, and its AI crawler logs show whether bots actually read a given comparison page. Its Page Tracker can also watch a competitor's comparison page and the prompts that cite it. Business plans add a Content Agent that can draft pages against the gaps it finds. There is a 7-day free trial and a free AI visibility report if you want a baseline first.
Other options exist, each narrower in scope:
| Tool | What it does | Good fit when |
|---|---|---|
| Promptwatch | Tracks prompts, citations, crawler logs, and AI traffic, plus content generation and publishing | You want to find gaps and fix them in one place |
| Otterly.AI | Brand mention monitoring across AI engines | You only need basic tracking |
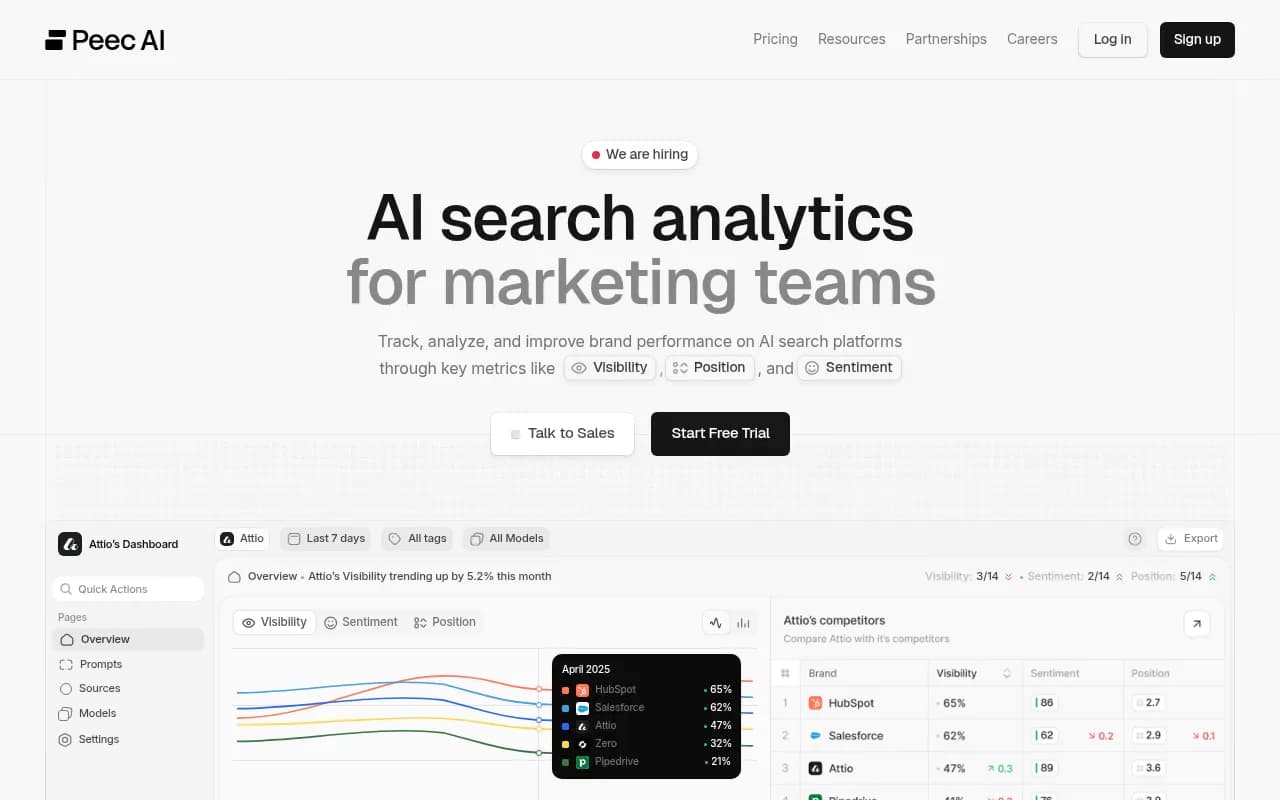
| Peec AI | Prompt-level visibility tracking | Small marketing team, monitoring only |
| Semrush | Traditional SEO suite with AI tracking add-on | You already live in Semrush |
| Google Search Console | Free search performance data | You want to see which comparison pages get impressions |
Otterly.AI

If you're shopping for trackers, the GEO software directory at bestgeosoftware.com lists more of them.
A checklist before you publish
- The first paragraph states a verdict and who should choose each tool
- The title and H2s name both tools and the audience
- A table covers 6 to 10 verifiable criteria
- Every competitor claim links to a source and a check date
- The competitor's strengths are stated plainly
- Pricing shows the plan, the unit, and the date checked
- Benchmarks include method, versions, and a repo link
- The page shows a named author and a last-updated date
- AI crawlers can fetch the page without JavaScript
- Docs, GitHub README, and G2 or Capterra profiles say the same thing
- A calendar reminder exists for the next review
Common mistakes
Writing a sales page in disguise
If every row ends in a checkmark for you and an X for them, readers and models both discount it. Include rows where you lose.
Comparing everyone at once
A 12-tool mega table is hard to keep accurate. Start with the two or three rivals your sales team hears about most, and write one page each.
Letting it rot
The data is clear that these pages are cited for months. That cuts both ways: a wrong claim stays in circulation too.
Ignoring the buyer
Most comparison traffic is a developer in the middle of a decision. A page that answers their real question, with a migration guide or pricing example, converts better than one stuffed for engines.
Where to start this week
Pick the single competitor that comes up most in your sales calls. Write one page with a verdict, a table of eight criteria, and honest notes on where they win. Verify every claim against their public docs, add the check date, and publish. Then run the three or four prompts a buyer would type and log the results. Repeat monthly. For more background on how citations work, see the Promptwatch Data hub.