Key takeaways
- Peak citation rate is your best single day, week, or prompt. Average citation share is your slice of all cited-source slots across a full window. They answer different questions and are not interchangeable.
- I found no source that defines "peak citation rate" as a standard metric. Treat it as a diagnostic or a campaign number, never as your headline KPI.
- Lead your report with average citation share over a stated window (monthly works well), with the prompt set, engines, and denominator written next to it.
- Citation share moves for reasons you do not control: model releases change the denominator overnight, and shares can halve or double inside a month.
- Report citation rate (answers that cite you at least once) as a companion, and label which one you are quoting every single time.
Why this question keeps coming up
Someone on your team screenshots a dashboard on a good Tuesday. "We were cited in 31% of answers!" Someone else pulls a monthly export and says the number is more like 9%. Both are telling the truth. Neither has said what they measured.
This is the core of the peak versus average argument. A peak number is a maximum. An average share is a ratio over a window. Mix them up in a board deck and you will either oversell, or get caught underselling when a competitor shows a calmer, more honest chart.
Let me be clear about one thing first. "Peak citation rate" is not a formally defined metric in any source I reviewed. The established terms are citation rate, citation share (also called Share of Citation), mention rate, and share of voice. So when I say peak, I mean the highest value of any of those over a sub-window: your best day, best week, or best-performing prompt. That is still worth understanding, because people report it constantly, often without saying so.
The definitions, side by side
Two things get called "citation rate" and "citation share," and they use different denominators.
- Citation rate: answers that cite you at least once, divided by all answers sampled.
- Citation share (Share of Citation): your qualifying citations divided by every qualifying citation counted in the same answers, times 100.
Authority Tech's Share of Citation guide gives a clean example from a November 9, 2026 index release: reddit.com holds 1.17% of all domain citations and is cited in 7.05% of answer runs. One sample, two correct numbers.
That gap matters. Citation rate tells you how often you show up at all. Citation share tells you how much of the evidence pool you own, and it drops when a competitor gains citations even if your own count stays flat.
| Metric | Question it answers | Denominator | Sensitive to |
|---|---|---|---|
| Citation rate | In what share of answers am I a source? | All answers sampled | Prompt set, run count |
| Citation share | How much of the cited-source pool do I own? | All citations in those answers | Competitors, citations per response |
| Mention rate | How often am I named? | All answers sampled | Brand association |
| Share of voice | My presence vs competitors | All brand appearances | Competitor set |
| Peak value (any of the above) | What was my best moment? | A sub-window | Cherry-picking, noise |
What "peak" actually captures
A peak can be three different things:
- Your best single day in a month.
- Your best prompt or topic, such as the one branded query where you are cited every time.
- Your best model or country, for example a strong showing in one AI engine.
All three are real observations. None is a summary.
The reason peaks mislead is measurement noise. Nick Lafferty's AI visibility metrics reference opens with the point that every AI visibility number is a sample estimate, and most dashboards present it like a census. He cites an arXiv paper from March 2026 (2603.08924, Ronald Sielinski) finding that citation distributions follow a power law, that sample-to-sample variability is large, and that many domain-level differences marketers report fall inside the noise floor. He also cites Profound's tracking of 22.5M ChatGPT Shopping offers, where 95% of product titles appeared in under 30% of runs of the same prompt.
If results swing that much between runs of the same prompt, then the maximum of a bunch of runs is mostly luck. Take the highest of thirty noisy daily readings and you have measured the noise ceiling, not your visibility.
Why average share is the better headline
An average over a month smooths run-to-run variance and gives you a number you can defend. Lafferty's example is blunt: a 0.50% citation share of a 48,589-citation topic window is a real measurement, while "12% Share of Voice" with no denominator is marketing.
The value of averaging is not that it is more flattering. It usually is not. It is that someone can reproduce it.
One caution. Even an average share is conditioned on the prompt set, engines, dates, counting rules, competitive set, and denominator. No benchmark travels cleanly between studies. Your 4% and a vendor's 4% are only comparable if both of you counted the same way.
Share is volatile, so one month is also a snapshot
Averages help, but a single averaged period can still mislead. Promptwatch Data on ChatGPT citation share in June 2026 shows how far a share can move. For May 31 to June 26, 2026, reddit.com held 3.71% of all ChatGPT citations, down from 6.11% in May, a fall of roughly 40% in a month. Wikipedia, the runner-up, had 0.56%, and no domain held more than 4% in June. Smaller domains moved the other way: GitHub rose from 0.23% to 0.27%, and Trustpilot from 0.18% to 0.22%.
Promptwatch's own recommendation from that report is to track citation share monthly, not from one snapshot, because a domain's share can halve or double within a month. I agree with that, with one extension: keep the monthly series and look at the trend, not any one point.
The denominator can change without you doing anything
This is the part most reports skip. Citation share is a ratio, so if the number of citation slots changes, your share changes even when your content does not.
Promptwatch's ChatGPT citation drop report found that around the GPT-5.3 rollout on March 4, 2026, average citations per search-enabled ChatGPT response fell from about 6.4 to roughly 4.7 to 4.9. That is about 27% fewer citation slots, and it had not recovered a month later. The drop hit GPT-5.3, GPT-5.4, and GPT-5-Mini within a day of each other (reporting window Feb 26 to Mar 11, 2026, search-triggered responses only).
Two practical consequences:
- Check any dip against model release dates before you blame your content.
- Track citations per response next to your own numbers so you can separate "we lost ground" from "the pie shrank."
Peak values are even more exposed here. A peak set before a model change and an average computed after it describe different systems.
Peak versus sustained: what persistence data says
There is one legitimate reason to care about peaks: some content spikes and fades. Promptwatch's half-life of content in ChatGPT report followed every page ChatGPT cited on July 6, 2026 for 90 days, to October 4, 2026.
| Content type | Still cited after 30 days | Still cited after 60 days |
|---|---|---|
| Landing pages | 78% | 69% |
| Docs | 76% | 67% |
| Comparisons | 72% | 63% |
| Product pages, reviews, how-tos | n/a | 55% (half-life 74 to 77 days) |
| Listicles | n/a | 60% |
| News | n/a | 41% (half gone by day 36) |
About a quarter of news pages are never cited again after day 0. The report notes that all lines drop in the final week because the window ends, so the longest-lived types likely have a half-life near or beyond 90 days.
My inference, not the report's: if a large share of your citations come from news-type content, a one-day peak overstates durable visibility badly. If most come from landing pages and docs, peak and average sit closer together.
A reporting setup that holds up
Here is what I would put in front of a leadership team.
The headline
Average citation share over a calendar month, for a named prompt set, across named engines. Always state the denominator, such as "0.50% of 48,589 citations in the topic window."
The companions
- Citation rate for the same window, labeled as such.
- Mention rate, since high mentions with low citation share means engines know you but use other sources as evidence.
- Citations per response, as a denominator health check.
- Sentiment and accuracy, because being cited with wrong claims is its own problem. Capston's four-metric breakdown makes this case well: a single blended visibility score hides what moved and why.
Where peaks belong
Put them in an appendix or a campaign recap, clearly labeled: "Best week: citation rate 18% after the product launch, versus 9% monthly average." That is honest and still useful. It shows what a launch can do without pretending it is steady state.
A short checklist
- Name the metric (rate or share) every time.
- State the window, prompt count, engines, and countries.
- Show the denominator.
- Report a trend across several months, not one reading.
- Annotate model releases on the chart.
- Show a range or sample size if you have run counts per prompt.
What the engines are starting to report natively
Microsoft added a Citation Share report to Bing Webmaster Tools in preview in June 2026, defined as the percentage of citations attributed to your site out of all citations shown across all sites for the same grounding query (per Authority Tech's write-up). That is a good sign that share, not a peak, is becoming the standard framing. Note that it is per grounding query and covers your own site, so a cross-engine, competitor-level view still needs a declared prompt sample of your own. Bing Webmaster Tools is free if you want to look at it alongside your tracker.
Tools that can produce these numbers
You need a tracker that exposes both the denominator and the time series, plus citation rows you can export. A few options that cover this:
Promptwatch tracks citation share per topic, shows citation rank and self-citation rate, and has Citation Trends with first cited date, peak, and decay half-life per cited page, which is the nearest thing to a built-in peak versus sustained view. It also runs monitors from the real interfaces of ChatGPT, AI Overviews, and AI Mode, and the Visibility Score is documented in its metrics academy. Prompts run daily on every plan, and Business can run every 12, 6, or 1 hours, which helps if you want enough runs to tighten a noisy number. Confirm current plans at promptwatch.com/pricing.
Others worth a look:
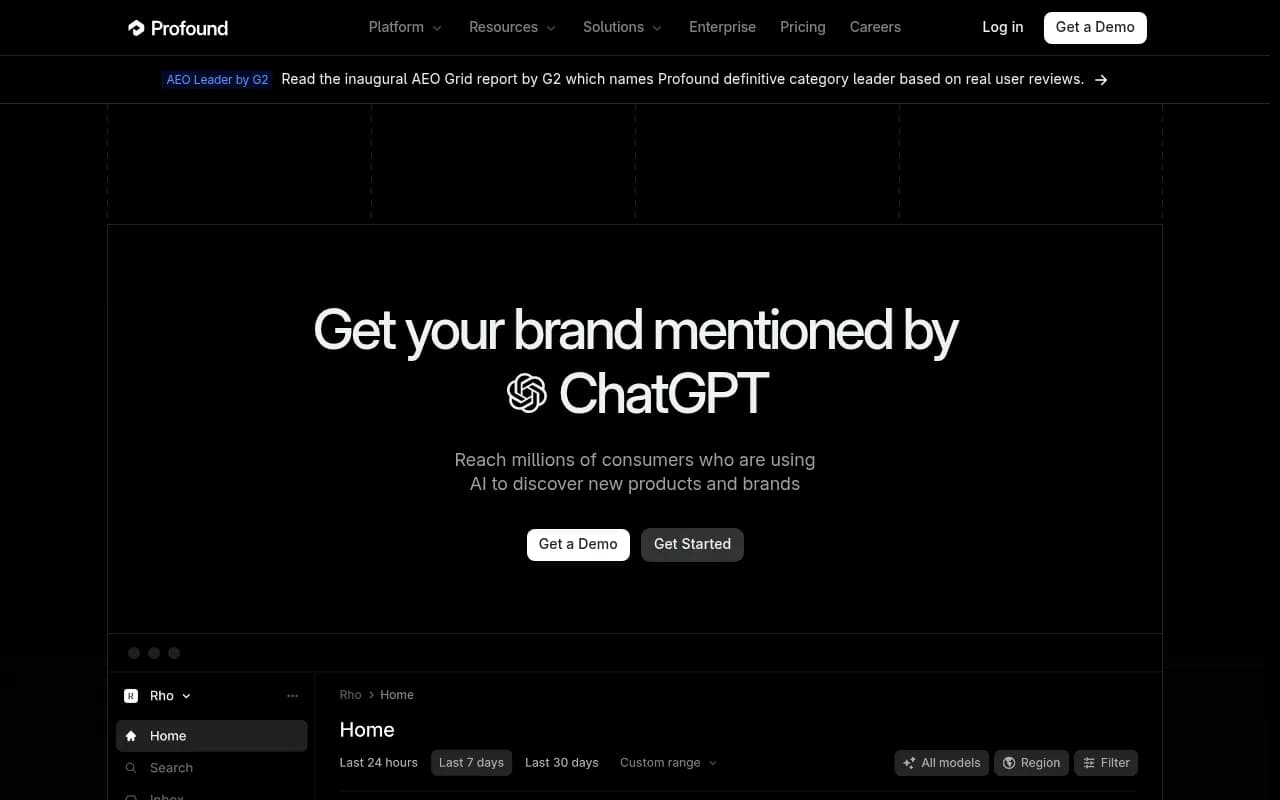
Profound
Otterly.AI


| Tool | Type | Good for |
|---|---|---|
| Promptwatch | Visibility and optimization platform | Citation share by topic, page-level citation lifecycle, fixing gaps |
| Profound | Enterprise monitoring | Large-scale citation data |
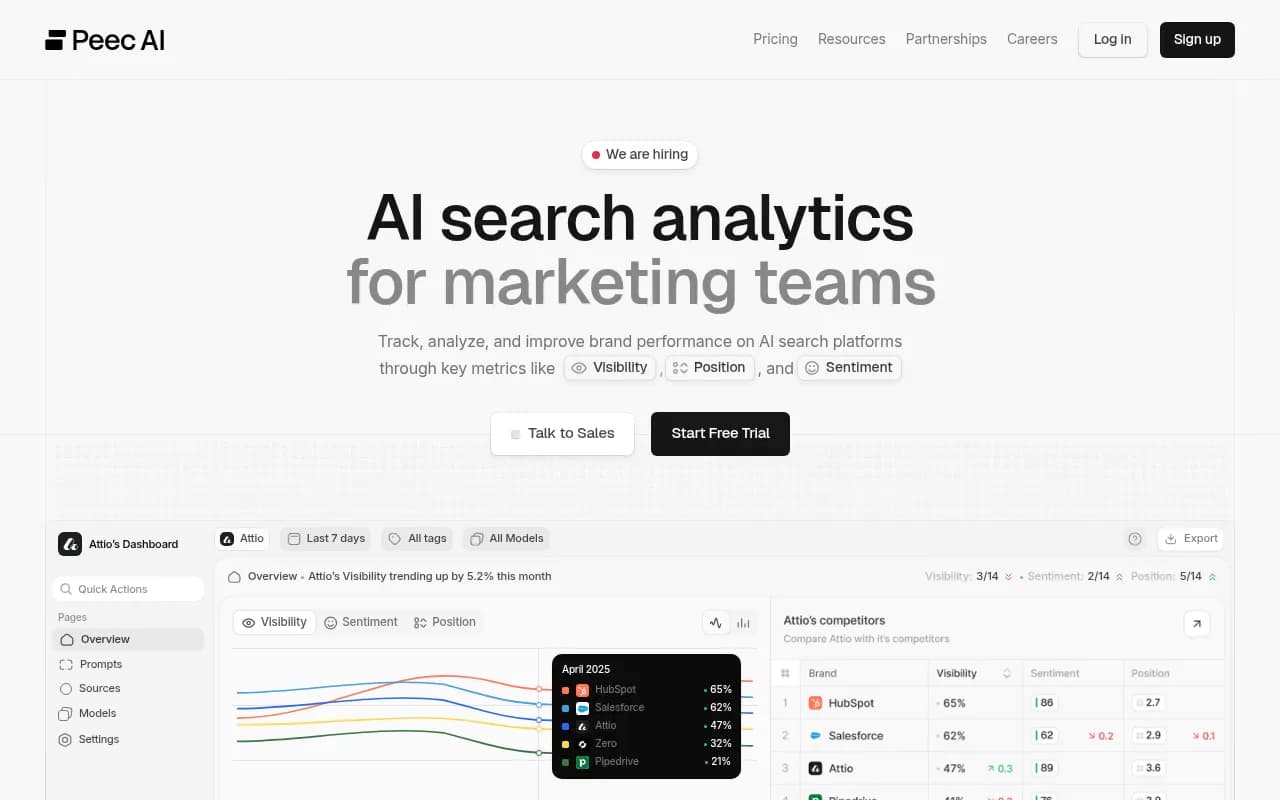
| Peec AI | Prompt tracker | Lightweight share and mention tracking |
| Otterly.AI | Prompt tracker | Basic brand monitoring |
| AthenaHQ | Monitoring | Visibility tracking across engines |
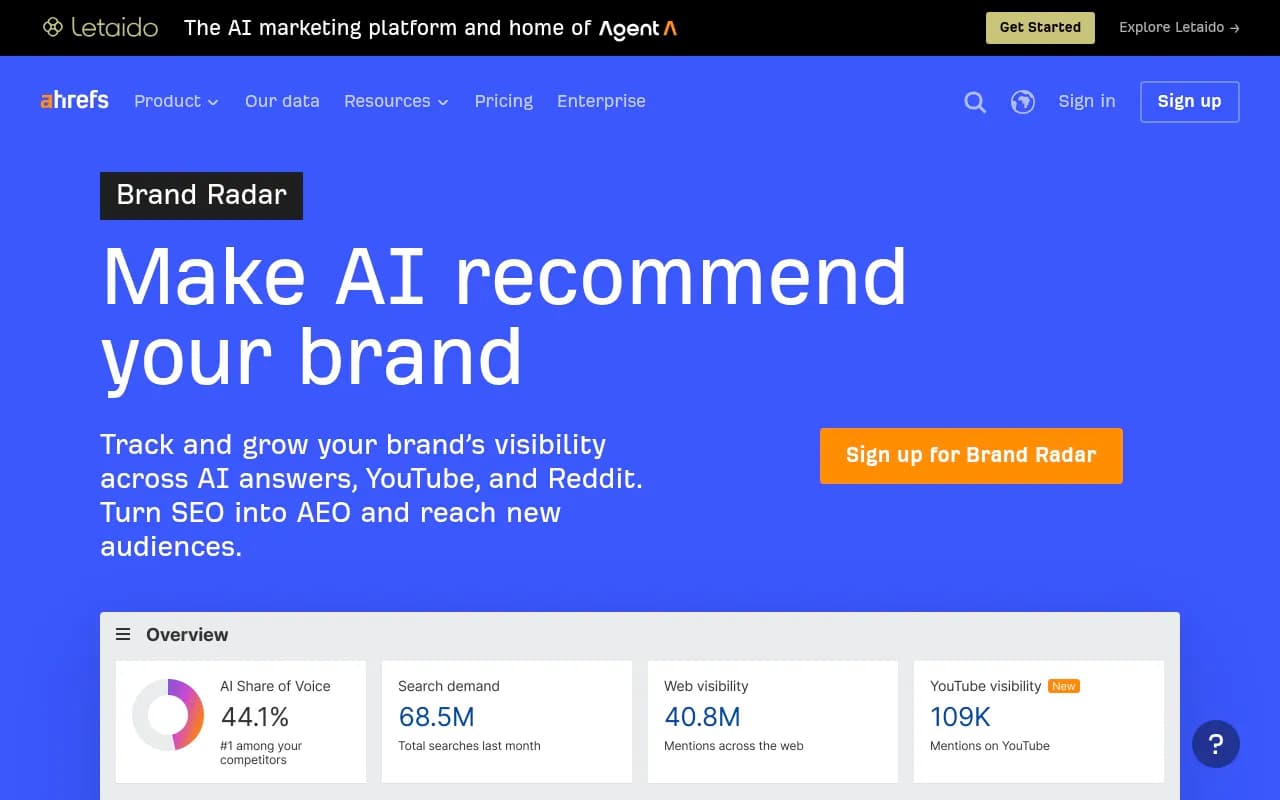
| Ahrefs Brand Radar | SEO suite add-on | Teams already in Ahrefs |
For a wider list, the GEO software directory at bestgeosoftware.com is a decent place to compare options.
Questions to ask whatever tool you use
- Does the share number show its denominator?
- Is the prompt set fixed, or does it change under me?
- How many runs sit behind each data point?
- Does it say whether it reports citation rate or citation share?
- Can I export raw citation rows to recompute it myself?
If a vendor cannot answer the first and last of those, treat their numbers as directional.
The short answer
Report average citation share as your headline, over a stated window, with the denominator beside it. Add citation rate as a labeled companion. Keep peaks for diagnostics and campaign recaps, and say plainly that they are peaks. When a dip or jump shows up, check the model release calendar before you rewrite a single page.
Want the same logic applied to your own data? A free AI visibility report is a quick way to get a first baseline, then build the monthly series from there.