Key takeaways
- Most day-to-day movement in prompt tracking is sampling noise. Each run is one draw from a probability distribution, not a fixed fact about your brand.
- Track more prompts rather than running the same prompts more often. Prompt count sets how precisely you know your visibility level, while run count sets how fast you can detect change.
- Read weekly and monthly trends, not daily numbers. Peec AI's analysis puts the real-change threshold at roughly 12.4 percentage points daily, 4.7 weekly and 2.3 monthly.
- Some overnight swings are real, but they come from the AI platform, not your content. Check the date against model releases before you blame yourself.
- Keep your prompt set stable, log every change, and split branded from non-branded prompts.
The 46% to 41% to 45% problem
You open the dashboard and your visibility score fell from 46% to 41%. Nobody shipped anything. No competitor launched a campaign. You spend the afternoon digging for a cause, find nothing, and the next morning the score is 45% again.
This happens to everyone who tracks AI answers, and it is the number one reason teams lose trust in the data. The frustrating part is that the swing has an explanation, and it usually isn't you.
There are really two sources of daily change. One is statistical: AI answers are probabilistic, so any small sample wobbles. The other is structural: the platforms themselves change how they search and cite, sometimes overnight. You need to handle both, and they call for different responses.
Why AI answers vary: every prompt is a biased coin
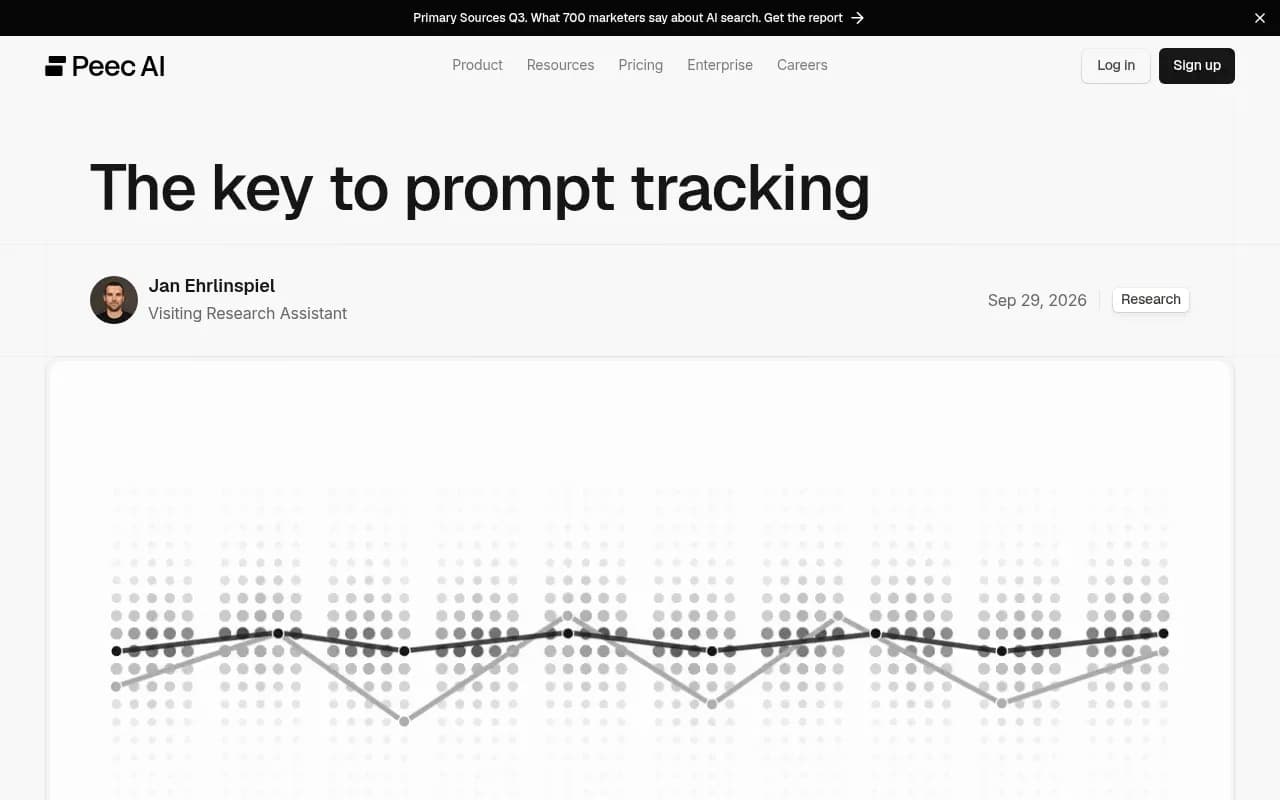
Peec AI published a useful framing after analyzing seven months of visibility data across roughly 120 million chats. Imagine a coin that lands heads 8 times out of 10. Flip it once and you learn nothing about the weighting. Flip it a few hundred times and the 80% emerges.
A tracked prompt works the same way. The wording of the prompt sets a rate at which an engine mentions your brand. Every run is one flip: mentioned, or not. Your "visibility" for that prompt is the hidden weight of the coin, and any single day is only a handful of flips.
The same logic shows up in other vendors' guidance. Run a prompt 10 times and appear in 7, and your presence is 70%. ScaleTheory's cadence guide points out that this only means something if 10 runs is enough to smooth out the variation, and for most prompts it isn't. HubSpot's cadence guide says it more bluntly: a single manual check in ChatGPT is one draw from a distribution.
So if you checked ChatGPT by hand this morning and your brand was missing, that tells you very little. It might be tails on a coin that comes up heads 70% of the time.
Branded and non-branded prompts behave differently
Peec's database shows that about 40% of non-branded prompts are contested, meaning visibility sits between 10% and 90%. For branded prompts it is only about 10%. Branded prompts are mostly decided: the engine either knows you or it doesn't, and it says so consistently.
Non-branded prompts like "best invoicing software for freelancers" are where the coin is genuinely unfair in an unstable way, and where optimization work pays off. They are also where your daily numbers will bounce the most.
In practice, split the two on your dashboard. If you blend them into one number, a stable block of branded prompts dampens the swings and hides real movement in the competitive ones.
How many runs you need before a change is real
Here is the part that surprises people. Knowing a prompt's visibility level takes a lot of runs. Confirming that it changed takes roughly double again.
Peec's math is blunt about tracking a single prompt once a day: three months to a year to be certain about its level, and six months to two years to be certain about a change. Nobody should read one prompt that way.
The fix is aggregation. Here are the thresholds from their analysis, using a portfolio of 50 prompts:
| Reporting period | Runs behind the number | Changes smaller than this could be chance | Practical reading |
|---|---|---|---|
| Daily | 50 | About 12.4 pp | Check that collection ran. Ignore small moves. |
| Weekly | 350 | About 4.7 pp | Good for spotting real shifts after launches. |
| Monthly | 1,500 | About 2.3 pp | Reliable for reporting and decisions. |
Apply this to the opening example. A 46 to 41 to 45 bounce over 48 hours has about an 11% chance of happening by luck alone on daily data. On weekly data, the chance of a similar bounce drops to about 0.56%. On monthly data it is roughly one in 1.4 million. The daily wobble you panicked about was ordinary.
A caveat on these figures: they come from one vendor's dataset and constants, so treat them as a calibrated rule of thumb, not a law. Your own noise level depends on your category and prompt mix.
More prompts or more runs?
This is the question most teams get wrong, usually by cranking up run frequency on a small prompt set.
Your prompt portfolio is only a sample of the questions your market asks. Millions of questions hit AI assistants every day, and you track a sliver. If every prompt had the same true visibility, running one prompt 100 times would tell you the same as running 100 prompts once. They don't. Visibility differs between prompts, so your average depends on which prompts you chose and how many.
There are two separate jobs here:
- Knowing your visibility level depends on how many different prompts you track. More distinct questions means a better picture of the market.
- Detecting change depends on how many runs you accumulate on the same prompts, because you are comparing each prompt against itself over time.
Peec's example: 50 prompts run daily gives a daily level precision of about plus or minus 10.5 pp at 95% confidence. Spread the same number of samples over fewer prompts and the uncertainty rises to about plus or minus 15.8 pp, roughly 50% worse. Same compute, worse answer.
The takeaway is to widen the prompt set first, then keep it fixed so time can do its work. Scrunch makes the same point with a weather analogy: one station is not the weather, but a network of stations read consistently is a reliable trend signal. What matters is repeatability, not perfection.
The noise that is not noise: platform changes
If all daily movement were sampling error, a steady, big sample would flatten it out. It doesn't, because AI platforms change underneath you. This is the second category, and it is easy to confuse with the first.
Promptwatch Data has documented several cases where tracked results shifted overnight for reasons unrelated to any brand's content:
- Citation slots shrank. Around the GPT-5.3 rollout on March 4, 2026, ChatGPT went from citing about 6.4 sources per search-enabled response to about 4.7 to 4.9 by late March, roughly 27% fewer slots. The change landed within a day and did not recover a month later. See the ChatGPT citation drop report.
- Search behavior changed. On August 8, 2026, the share of ChatGPT fanout queries using the site: operator jumped from 0.37% to 16.8% overnight, and average fanout queries per response rose from about 1.08 to about 1.83. That is documented in the site: operator report.
- Fanouts drift. Average query length and fanouts per response moved in steps between December 2025 and April 2026, per the ChatGPT query fanouts report. Your content has to match the queries ChatGPT generates, not the user's prompt, so phrasing that matched last quarter may be stale.
- Reddit vanished. reddit.com's share of ChatGPT citations fell from roughly 4% to 0.5% on August 14, 2026, as covered in the Reddit citations report. If Reddit was part of your visibility story, that drop shows up in your numbers without you changing anything.
The pattern: a sampling-noise swing is small, random, and reverses within days. A platform shift is abrupt, affects many brands and prompts at once, and stays. That is the signature to look for.
A quick way to tell them apart
| Signal | Likely sampling noise | Likely platform change |
|---|---|---|
| Size of move | Within the daily threshold | Large and sudden |
| Duration | Reverses in 1 to 3 days | Persists for weeks |
| Scope | One or two prompts | Most prompts, often all models of one engine |
| Competitors | Move independently | Move in the same direction |
| Citations per response | Unchanged | Shifts across the board |
The last row is worth tracking on its own. If citations per response dropped everywhere, "we lost visibility" and "the platform is citing fewer sources" look identical in your score but need opposite responses.
Five rules for reading your dashboard
- Collect daily, interpret weekly. HubSpot's cadence guide recommends the same: collect daily where the tool supports it, interpret weekly, review conversion and experiments monthly, and look at pipeline context quarterly. Move to daily decisions only during launches or major changes.
- Set a threshold before you look. Decide in advance that a move under about 5 pp weekly is not a story. Writing the rule down stops a random swing from becoming a roadmap change.
- Judge against the market, not just yourself. Meteorologists ask whether a temperature is unusual for this place and season. Do the same: did you move, or did the whole category move? Peer-relative movement is a better default readout than raw levels.
- Keep the prompt set stable and log changes. Adding or swapping prompts breaks your trend line. If you want to test new ideas, use a separate rotating exploratory set, and keep a change log with the date, what changed, who approved it, and why.
- Don't chase spikes. Once you start reacting to hotspots, you change what you measure. A single prompt that jumps tells you almost nothing. A topic cluster that moves together is worth a look.
The same logic applies to cadence in the early weeks. ScaleTheory suggests tracking every day for the first two weeks to build a baseline, since 14 data points per prompt beat 2, and then stepping down to a few times a week once the baseline holds. If the numbers hold at the lower frequency, your baseline is real. If they shift significantly, investigate before reducing further.
Build a prompt set that doesn't add noise
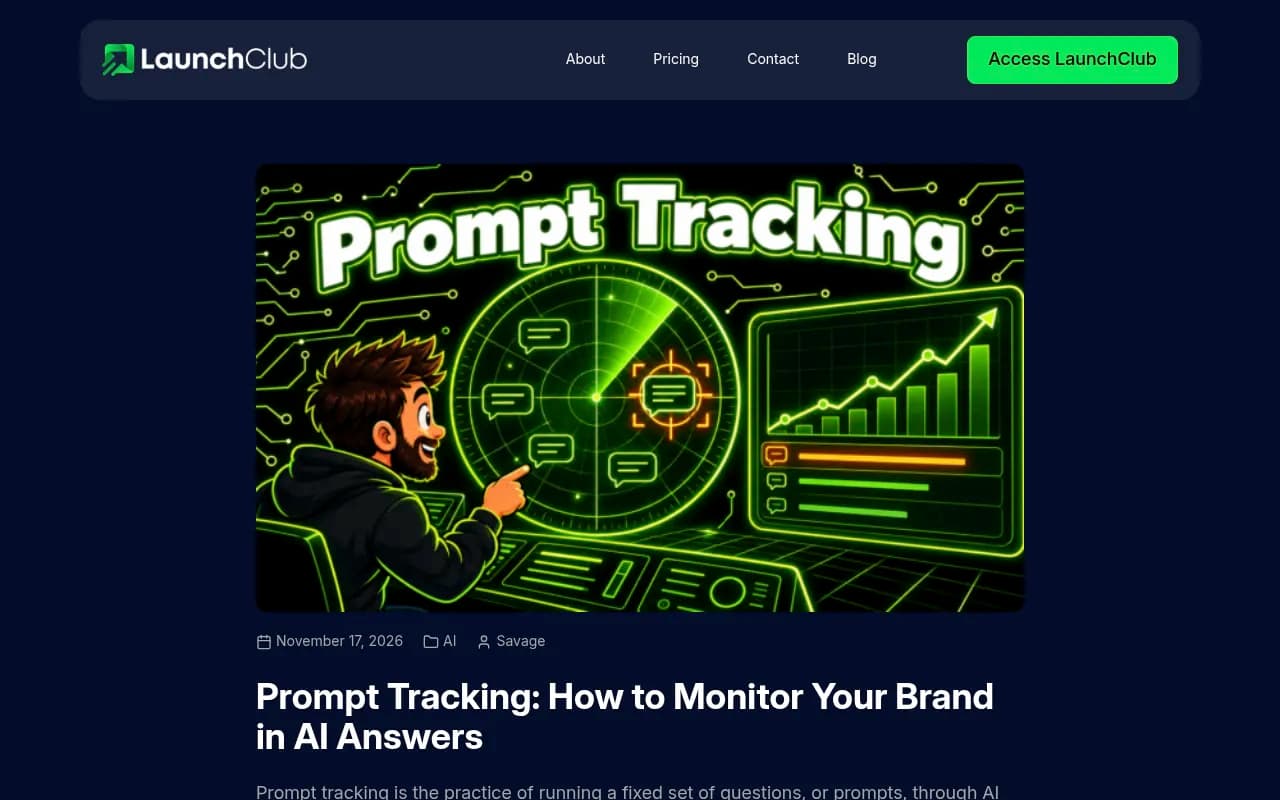
Your prompt library is a measuring instrument, and a sloppy one makes everything downstream noisier. Launch Club's guide gives a sensible recipe that I agree with:
- Start from real questions pulled from sales calls, support tickets, onboarding surveys, site search logs, and community threads.
- Cover the full journey: problem prompts, category prompts, comparison prompts, alternative prompts, and brand prompts.
- Write prompts the way people talk. AI prompts run longer and more conversational than keywords.
- Run them under consistent conditions, with the same models, the same country and language, and the same schedule.
That last point matters more than it looks. If your tool mixes locations or changes models quietly, you'll see movement that comes from the instrument. A monitor with a fixed country and language, run against the real interfaces of each engine, keeps the comparison honest. User-facing answers and citations can differ from API outputs, so decide which one you are measuring and stick to it.
What tooling helps
You can do this in a spreadsheet, but you'll run out of patience around 50 prompts across a few engines. A few things are worth looking for in a tracker:
- Real UI collection across several engines, not only API calls.
- Enough responses per plan to get past the daily noise floor.
- Trend views by week and month, with confidence-aware reporting.
- Citation and crawler data, so you can tell a content problem from an access problem.
- A way to split branded from non-branded prompts and group prompts by topic.
Promptwatch covers this with real-interface collection, topic-level Visibility Score and Share of Voice, citation trends, and IP-verified crawler logs. That last piece helps with the noise question: if AI bots are failing to read a page, the dip is a crawl problem, not randomness. Its Visibility Score definition is worth reading because it spells out how zero-mention responses are counted.
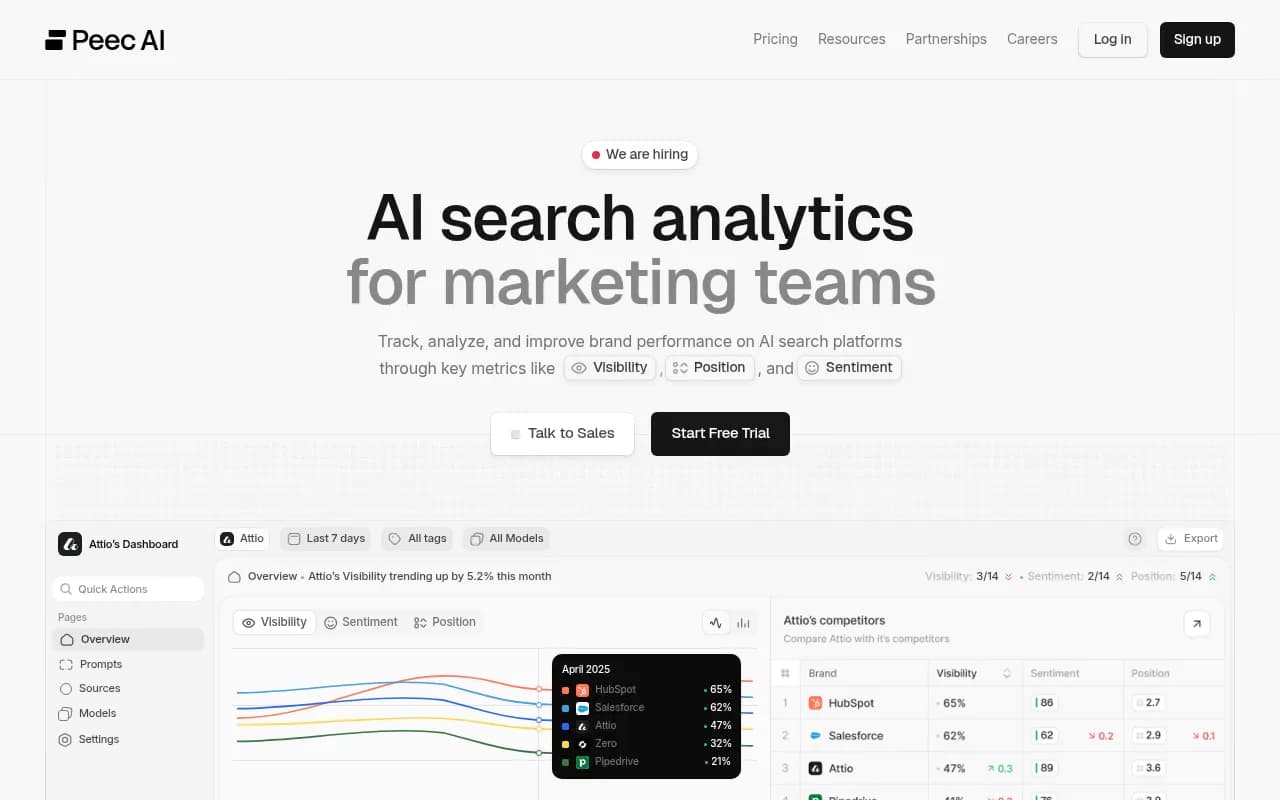
Other trackers cover parts of this. Peec AI is the source of the statistical analysis above and focuses on visibility tracking:
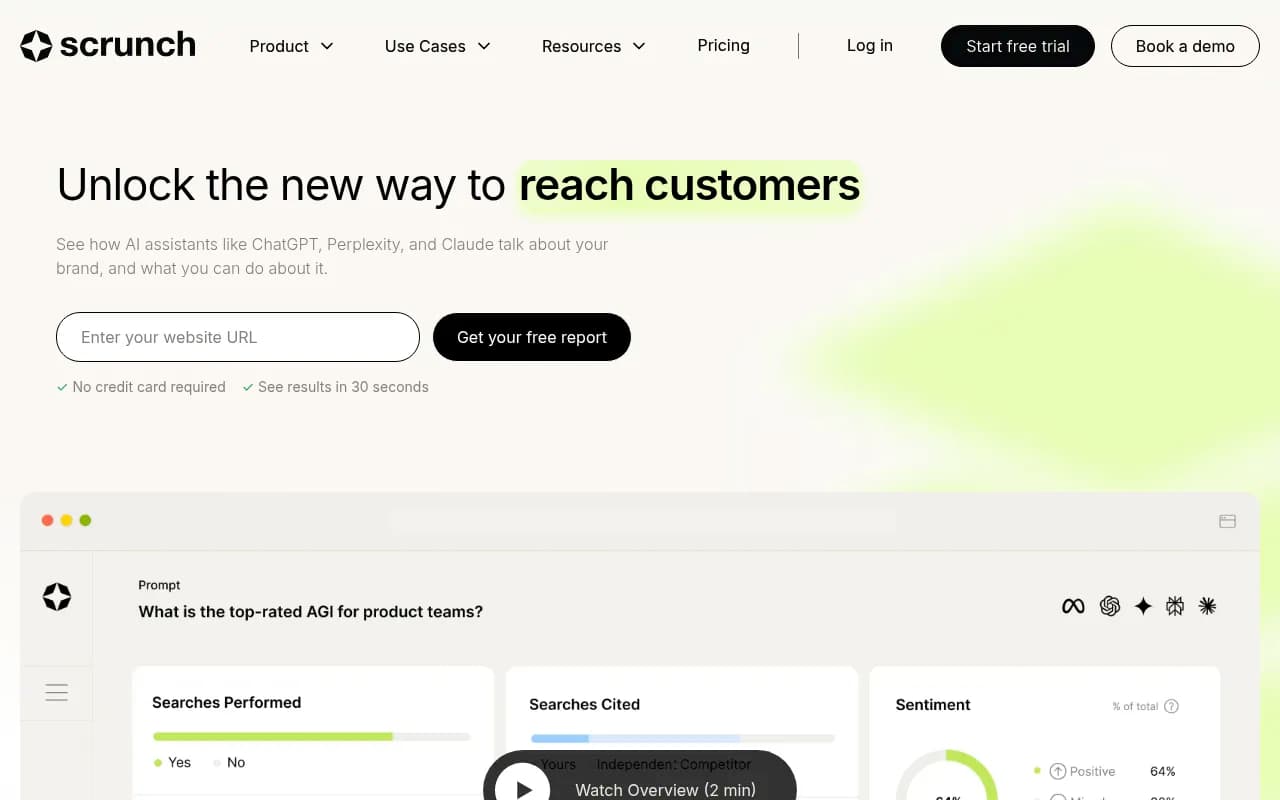
Scrunch pushes the panel-and-benchmark approach:
HubSpot's AEO tool runs each tracked prompt daily across ChatGPT, Perplexity, and Gemini and leans on weekly averages for interpretation:

Otterly.AI and Profound are other commonly shortlisted options:
Otterly.AI

Profound
| Tool | Strength for reading noise | Watch out for |
|---|---|---|
| Promptwatch | Visibility, citations, crawler logs and traffic in one loop, with topic and persona splits | Faster-than-daily tracking starts on Business |
| Peec AI | Clear public thinking on statistics and branded vs non-branded prompts | Primarily monitoring |
| Scrunch | Panel-based, benchmark-first approach | Higher price point |
| HubSpot AEO | Daily collection and weekly averages inside a familiar suite | Fewer engines than dedicated trackers |
| Otterly.AI | Simple, approachable monitoring | No crawler logs or visitor analytics |
For a wider shortlist, the GEO software directory lists dozens of trackers with reviews.
When faster tracking is worth it
I would not run hourly tracking for general reporting. It buys little precision on a stable prompt set, because the shared day-to-day shock in Peec's model doesn't shrink with more same-day runs.
Faster cadence earns its keep in specific moments: a product launch, a PR push, a site migration, or the days right after a known model release. There you want to see whether a change landed quickly, and you accept the extra noise in exchange for speed. Afterwards, drop back to a weekly reading.
A short checklist
- Is the move bigger than the threshold for this reporting period?
- Did it reverse within a few days?
- Did competitors move the same way?
- Did a model release or platform change happen around that date?
- Did citations per response change across the board?
- Did your prompt set, monitor settings, or tracked models change?
- Do the crawler logs show AI bots hitting errors on your key pages?
If the answers are no, no, no, no, no, no, no, then you are most likely looking at coin flips. Close the tab and check again on Monday.
The discipline here is boring but it works: a wide, stable prompt set, a weekly reading rhythm, and a written threshold. Teams that adopt those three things stop arguing about daily dips and start noticing the shifts that actually matter.