Key takeaways
- Report weekly to the working team, monthly to marketing leadership, quarterly to the board. Always compare against a fixed baseline.
- Six metrics cover it: prompt coverage, citation rate, share of voice, sentiment, accuracy rate and AI referral traffic. Keep the set at six so the report stays readable.
- AI answers change from run to run. Run each prompt several times per engine and report ranges, not single scores.
- Split results by prompt intent (commercial, informational, branded), because each intent pulls a different mix of sources.
- Every number should end in a decision. If a metric does not support one, cut it.
Why most AI rank reports get ignored
I have seen a lot of AI visibility reports, and the failure mode is nearly always the same. A 30-page export lands in a CMO's inbox, led by a "visibility score of 74" with no formula behind it. Nobody knows if 74 is good. Nobody knows what to do about it. The report gets filed.
A CMO needs a trend line, a competitive position, one risk and one ask. That is it. The granular data still matters, but it belongs with the working team and in an appendix, not on page one.
There is also a timing problem. RankinLLM argues that AI citation behavior runs on a roughly 70-day freshness cycle, so a quarterly-only review can miss a citation gained in week two that has eroded by week ten. That figure is one vendor's claim, so treat it as directional. The cadence logic still holds: collect weekly, summarize monthly.
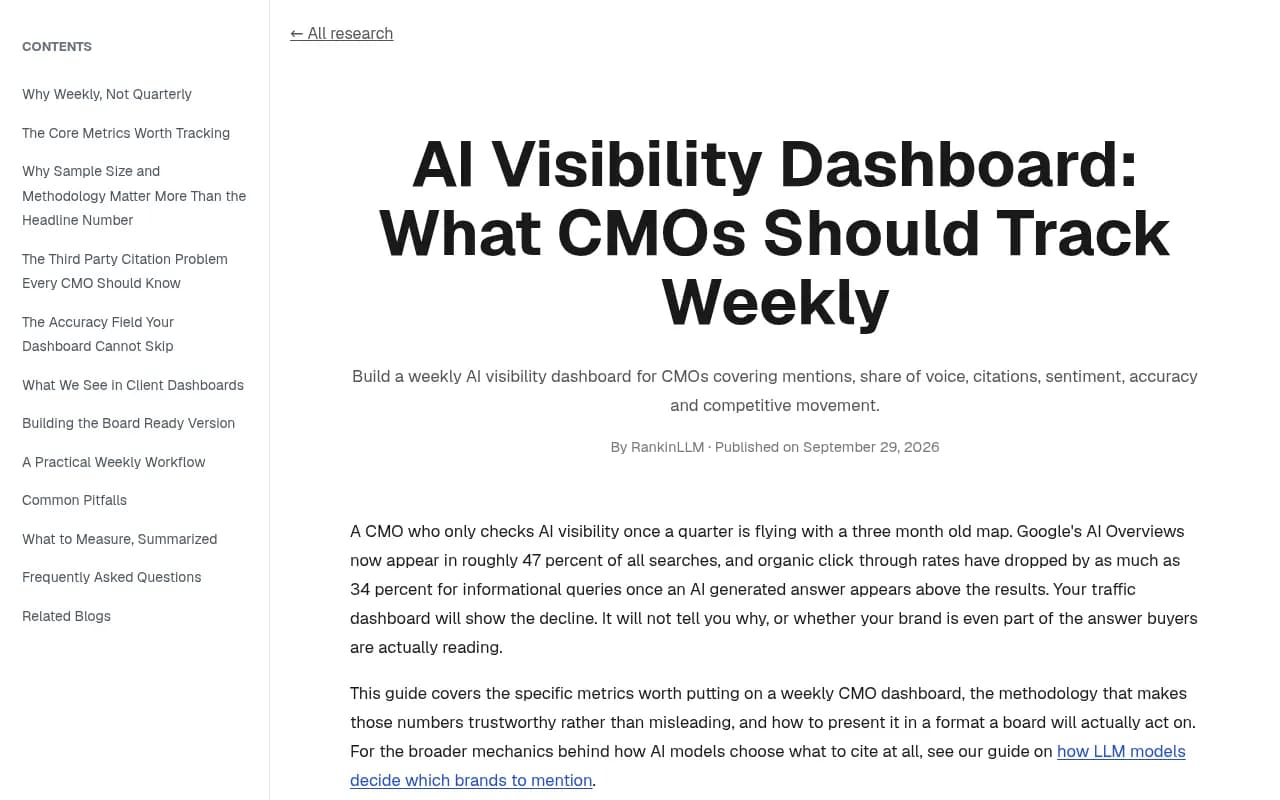
Who reads what, and when
| Cadence | Audience | What belongs in it |
|---|---|---|
| Weekly | Working team (SEO, content) | Per-prompt movements, lost and gained citations, crawler or access issues |
| Monthly | CMO and marketing leadership | Trended scorecard of six metrics, competitor position, notable movements, one risk, one ask |
| Quarterly | Board | One slide: six numbers against baseline, plus the decision needed |
This post is mostly about the monthly report, since that is the one a CMO actually reads and acts on.
The six metrics worth putting in front of a CMO
Cyberdunes proposes six formulas, and the Rankmasters and Cognizo templates land in similar territory. The definitions below are proposed, not an industry standard. Write the numerator and denominator on a whiteboard for each one. If you cannot, do not report it.
1. Prompt coverage (mention rate)
The share of tracked prompts where your brand appears at all. If 12 of 40 prompts name you, coverage is 30%. This is the AI equivalent of impressions and everything else builds on it.
2. Citation rate
The share of responses that link back to your content. Being named is not the same as being sourced. A brand can be mentioned in 40% of answers and cited in 5%, which usually points to a content or crawlability problem rather than a reputation one. Promptwatch has a short explainer on citations vs mentions.
3. Share of voice
Your mentions divided by your mentions plus all tracked competitor mentions, times 100, on a fixed prompt set. It puts your presence in competitive context. A flat coverage number with falling share of voice means competitors are gaining.
4. Sentiment score
Whether AI frames you favorably, neutrally or negatively. High visibility with poor sentiment is a worse position than it looks.
5. Accuracy rate
The share of AI claims about you that are correct: pricing, features, availability, who you serve. This is the metric that most often produces the "top risk" line on the slide. A wrong fact in a buying-stage answer is a concrete, fixable problem, which executives respond to.
6. AI referral traffic
Visits and conversions from AI engines. This connects the report to the website and to pipeline. One caveat for 2026: ChatGPT stopped sending a referrer on October 8, 2026, so you may need to count visits tagged with utm_source=chatgpt.com to avoid undercounting.
Method: what makes the numbers trustworthy
The reason AI reports lose credibility is not the metrics. It is the method. Four rules fix most of it.
- Freeze the prompt set. Pick a core list tied to your keywords and buyer questions, save it as the baseline, and add new prompts as a separate group. Changing the set mid-year breaks every trend line.
- Run each prompt multiple times per engine. Answers vary. Report a range (for example 28 to 34%) and note the variance.
- Segment by engine and intent. A brand can lead on ChatGPT and trail on Perplexity for the same prompts. Cognizo's template makes the same point.
- Keep time windows consistent. Promptwatch's own November 2026 social citation report compares a 30-day window to a 7-day October window and flags that this limits month-over-month comparison. Do not make that mistake in your own charts.
Why intent splitting matters
Promptwatch Data shows the content mix changes sharply by intent. For Sep 28 to Oct 4, 2026, product pages were 22.4% of ChatGPT citations overall, rising to 26.0% on commercial prompts, while how-tos were 10.7% of informational citations. A single blended number hides that.
Breadth matters too. In the same week, 47.6% of ChatGPT responses with citations named 10 or more domains, but brand-specific prompts averaged far fewer (only 21.3% reached 10). Their advice for reporting is worth copying: track position and description within the answer, track which competitors are co-cited, and measure across many prompts because one prompt tells you little.
The monthly template: seven sections in order
The Rankmasters template uses seven sections, and I think the structure is right. This version adapts it for a CMO audience.
- Summary (under 150 words). What changed, why, and what happens next, with one line per headline metric. Written last, read first.
- Scorecard. The six metrics, each with baseline, last month, this month and a trend arrow. Show ranges where you ran repeats.
- Competitor position. Share of voice by named competitor, plus the competitors most often co-cited alongside you.
- Citations. Pages cited this month by prompt and engine, and the prompts where a citation appeared or disappeared.
- Accuracy and sentiment. Incorrect or unfavorable claims, which page is likely the source, and the status of the fix.
- Traffic and conversions. AI referral visits next to organic sessions, kept on one page. AI traffic is small for many brands, so do not overstate it.
- Actions and appendix. Each action gets one owner and one due month. The appendix lists the prompt set, engines, run dates, runs per prompt and any change to the set.
The one-slide version for the board
Cyberdunes recommends one slide with six numbers, trend against baseline, one risk and one ask. Include:
- The six KPIs with baseline and trend
- The prompt set and engines used
- Number of runs per prompt, plus a one-line note on variance
- The top risk, such as a wrong fact in a buying-stage answer
- The decision you need from the board
Frame gains in business language. "We now appear in more buying-stage prompts" lands better than "visibility rose 6 points."
Where each number comes from
| Metric | Typical source | Limit to state in the report |
|---|---|---|
| Prompt coverage, share of voice | Your prompt runs or a tracking platform | A sample, not true market share |
| Citation rate and cited pages | Prompt runs; Bing Webmaster Tools for Bing | Bing data says nothing about ChatGPT or Gemini |
| Sentiment, accuracy | Prompt run responses, reviewed by a human | Needs a person to judge claims |
| AI referral traffic | Web analytics | Referrers are inconsistent, so undercount is likely |
| Organic sessions and rankings | Analytics and a rank tracker | Says nothing about AI answers |
State these limits in the appendix. Executives trust a report more when it says what it cannot tell them.
Tools for building the report
You can run this in a spreadsheet. The Rankmasters template is a Google Sheet with a tab per section. A spreadsheet works for 40 prompts and one engine. It gets painful with multiple engines, repeat runs and several markets.
Tracking platforms
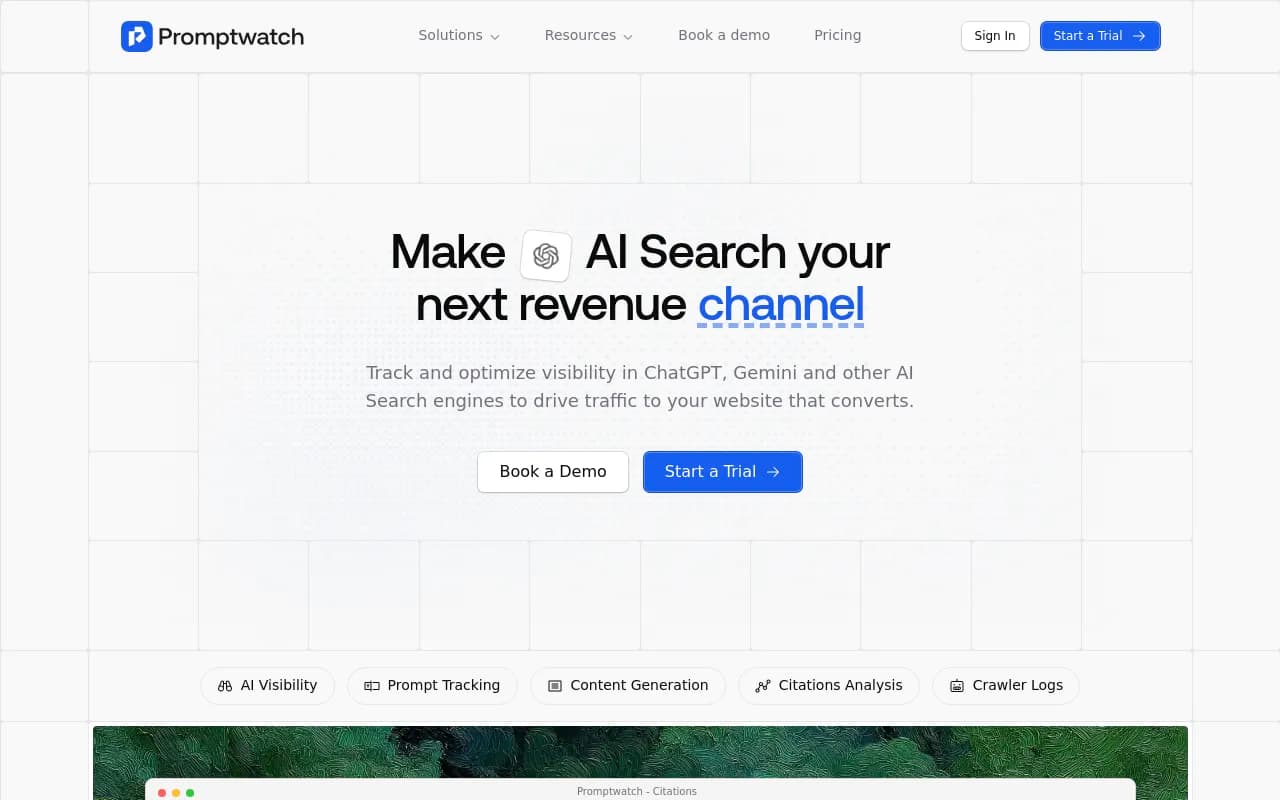
Promptwatch is the one I would look at first if you want the whole report fed from one place. It tracks real interfaces of ChatGPT, Gemini, Perplexity, AI Overviews and others, scores Visibility Score, Share of Voice, position and sentiment, extracts Brand Narrative claims (and Fact Check on Business plans) for the accuracy line, and ties AI crawler logs and visitor analytics to the traffic section. Scheduled PDF reports and a Looker Studio connector help with the monthly send. Pricing starts at $95/mo on Essential, so confirm current plans at promptwatch.com/pricing.
Other options in the catalog cover narrower ground:
Otterly.AI

Profound
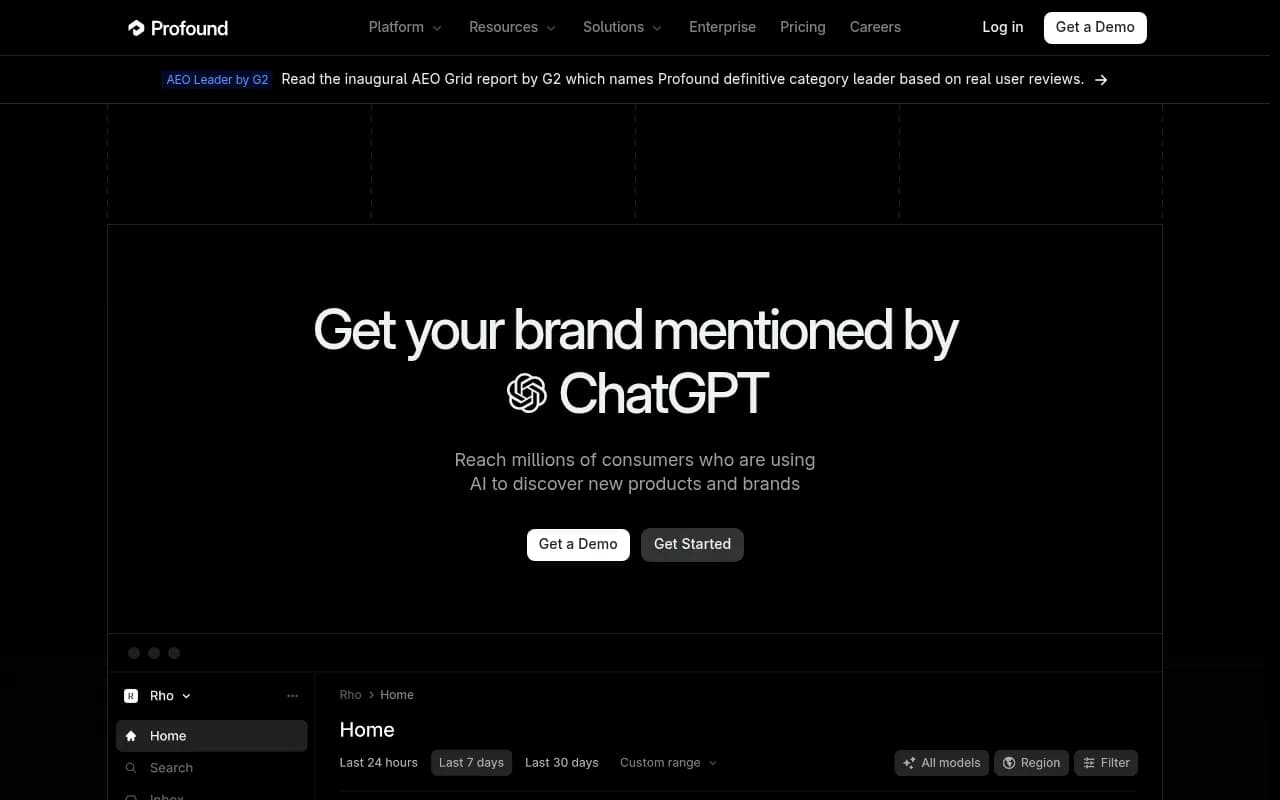

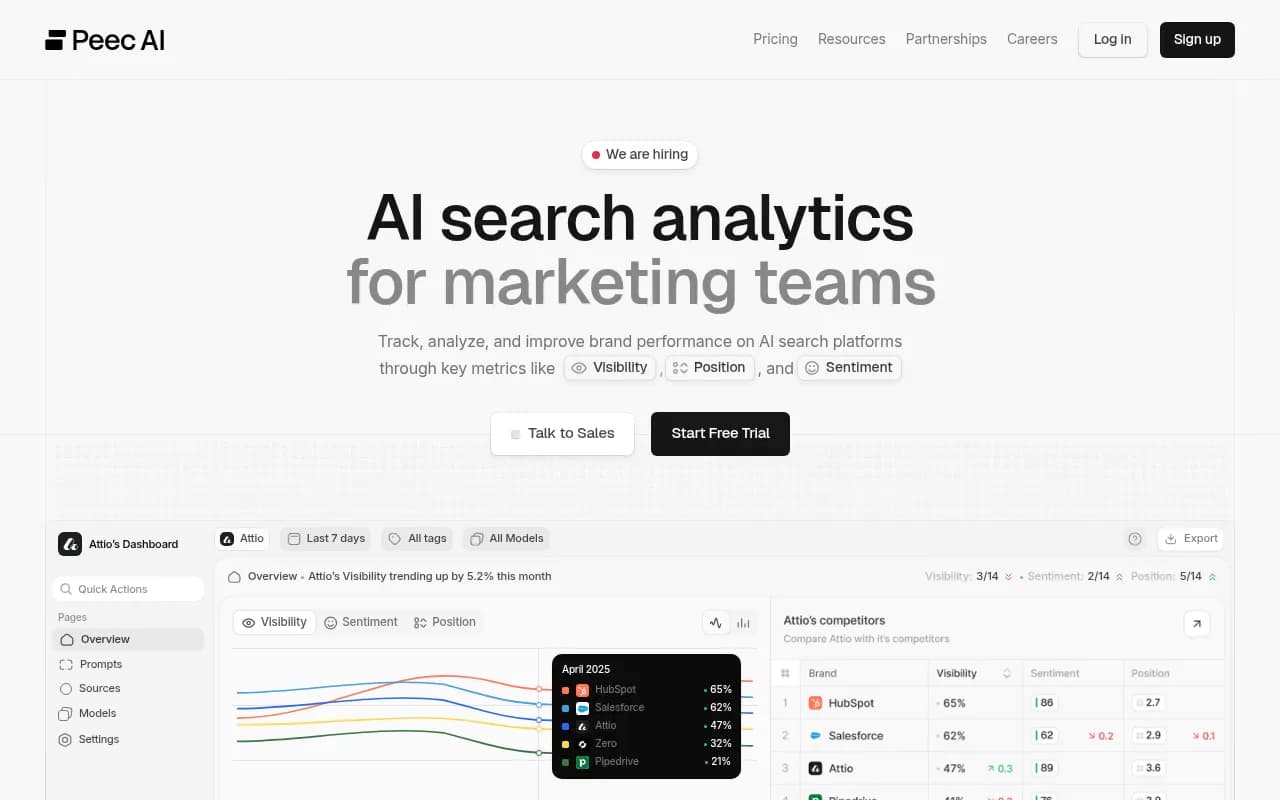
Broadly, Peec AI and Otterly.AI focus on prompt tracking and reporting, Profound targets enterprise monitoring, and Rankshift tracks visibility across engines. Check each for crawler logs, traffic attribution and content execution if you need those in the report. Directories such as the GEO software directory at bestgeosoftware.com and AI rank tracking tools help you compare more.
Reporting and dashboard layers
If your CMO lives in slides or BI dashboards, the tracking tool is only half the job.
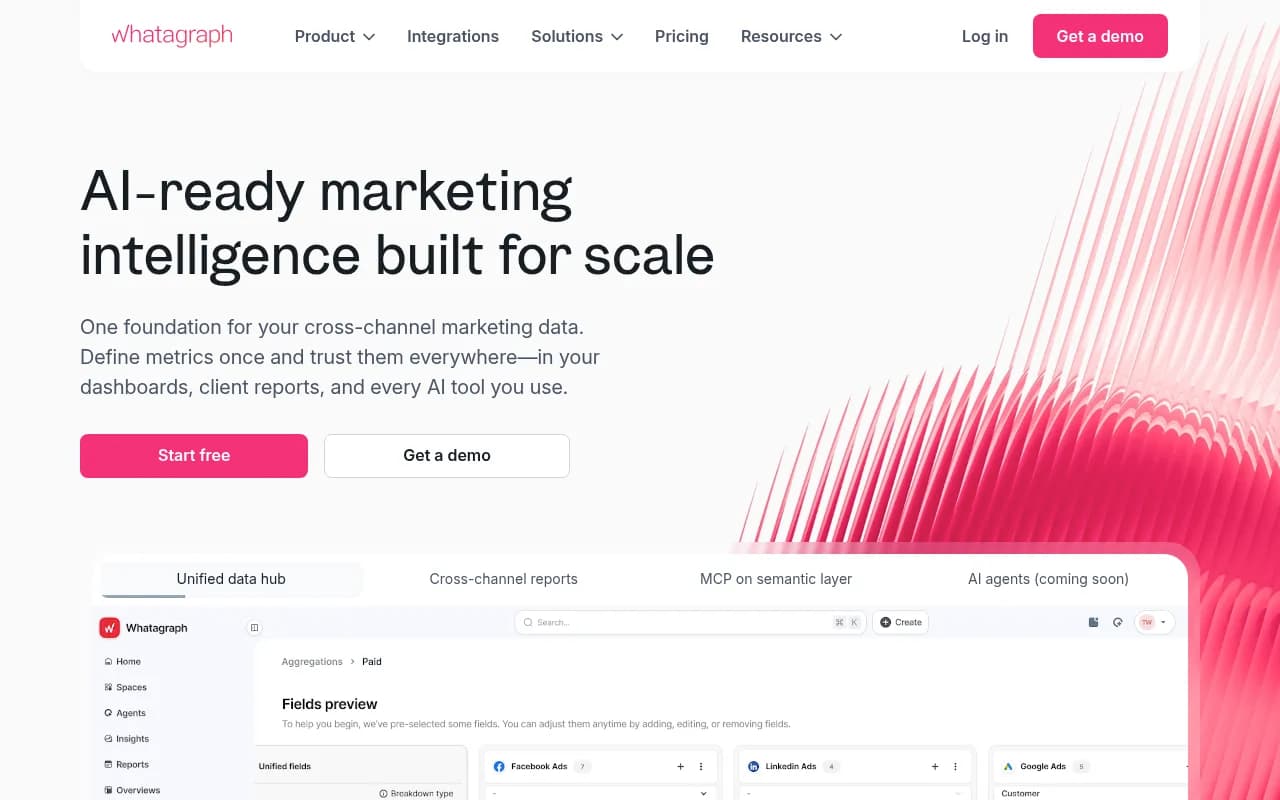
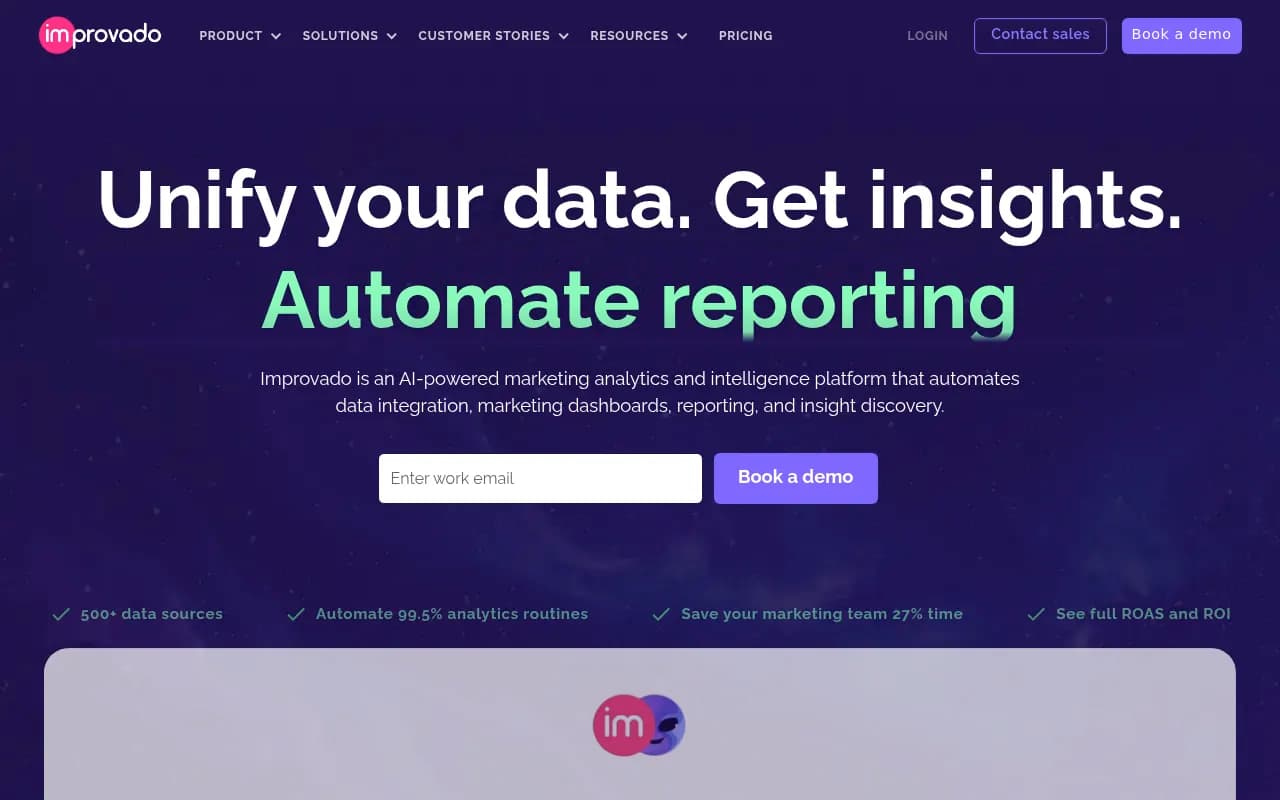
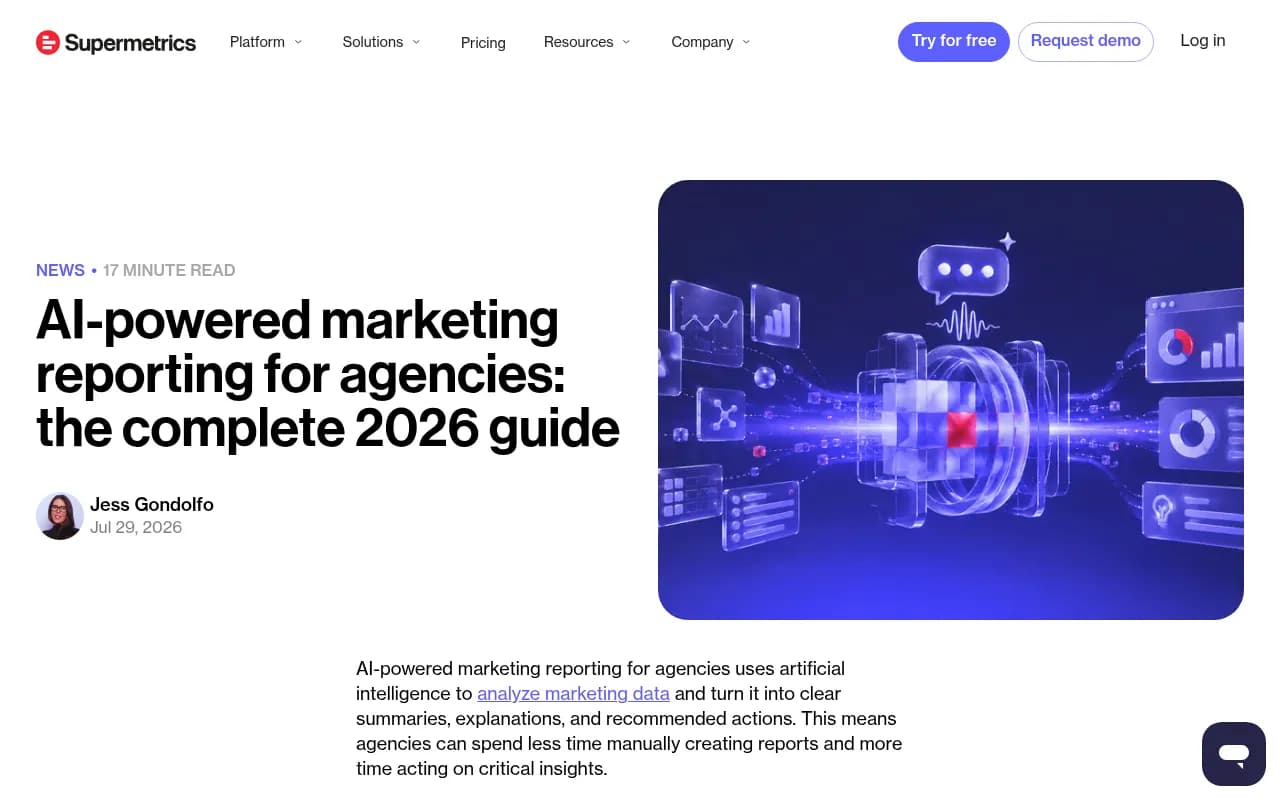
Whatagraph suits agency-style recurring reports, Improvado pulls marketing data into one warehouse or view, and Power BI works if your leadership already runs on it. Supermetrics describes a similar flow, in which AI drafts summaries over governed data and a human reviews before anything reaches the client.
Traffic and search data
These three feed the traffic section and the traditional SEO page. Keep that page to one page.
How to build the report, step by step
- Fix the prompt set. Start with 30 to 50 prompts mapped to buyer questions across commercial, informational and branded intent. Save it as the baseline.
- Choose engines. At minimum ChatGPT, Google AI Overviews, Gemini and Perplexity. Add others where your buyers actually are.
- Run each prompt several times per engine and log engine, date, mention, cited domains and cited pages.
- Compute the six metrics, with ranges, and compare to baseline.
- Fill sections two through seven.
- Write the summary last, in under 150 words.
- Assign every action one owner and one due month.
- Send a PDF or a link, and paste the summary into the email body so it gets read. Keep the section order identical every month.
Can AI write the report for you?
It can draft the summary once the sections are filled, and that saves real time. Rankmasters says the same: it cannot run your prompts, pull your data or be trusted to supply a figure. Check every number before it ships.
Common mistakes
- Leading with a composite score nobody can explain.
- Changing the prompt set between months.
- Reporting a single run as a fact.
- Mixing 7-day and 30-day windows in one chart.
- Showing mentions without citations, or the reverse.
- Burying the risk on page six.
- Ending with data instead of a decision.
A note on getting help
If you would rather not build and run this each month, agencies can do it. 1001 SEO Media runs GEO and AI search reporting for brands and uses Promptwatch as its visibility platform, but any team that can freeze a prompt set and keep a consistent method can do this in-house.
Closing checklist
Before you send it, confirm that the summary is under 150 words, the six metrics show baseline and trend, the prompt set, engines and runs per prompt are stated, variance is noted, one risk is named, and one decision is requested. If all of that fits on one page, your CMO will read it.