Metabase Review 2026
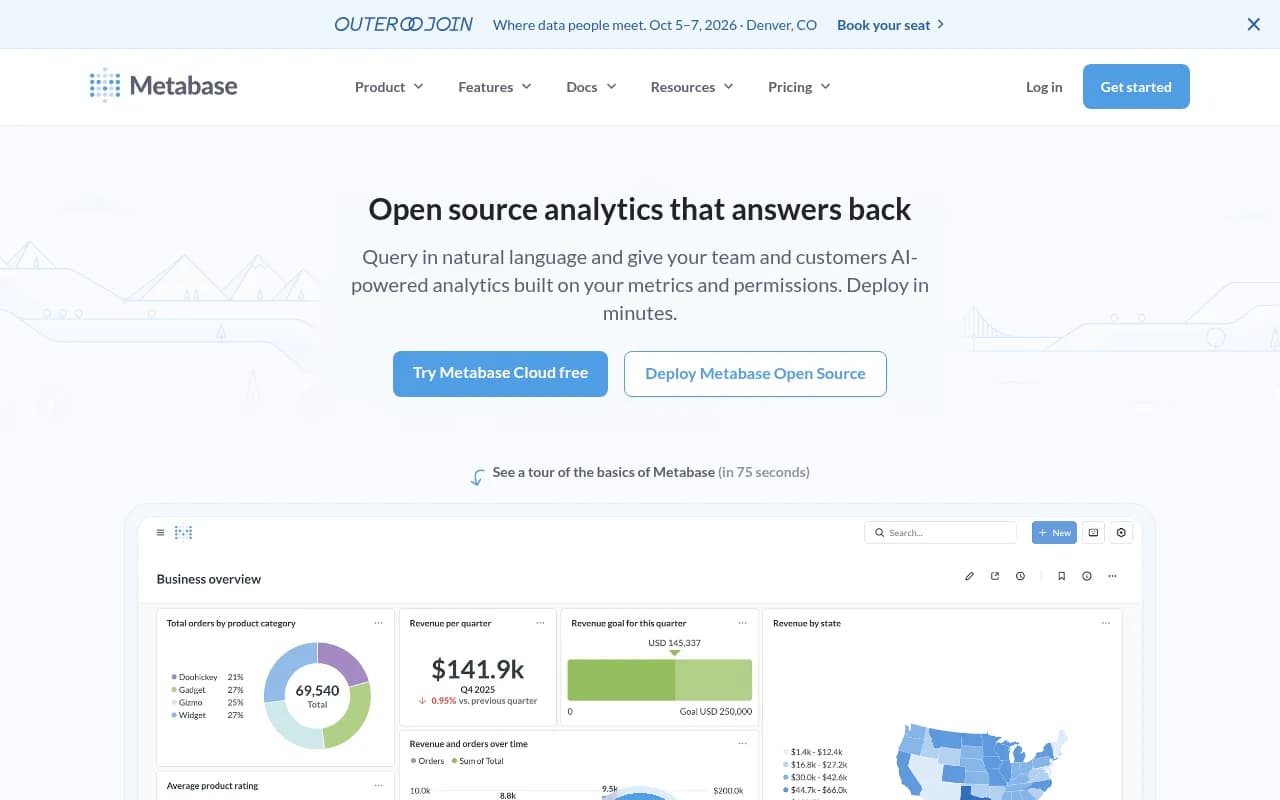
A business intelligence tool that lets anyone ask questions and visualize data without writing SQL. Available as open-source self-hosted or a managed cloud service.
Key takeaways
- Metabase is one of the most widely adopted open-source BI tools available, with 48,000+ GitHub stars and 90,000+ companies using it -- from early-stage startups to McDonald's and Capital One.
- The free, self-hosted open-source edition is genuinely capable: visual query builder, dashboards, alerts, and now AI features if you bring your own LLM key.
- Cloud pricing starts around $500/month for production-grade setups, which is competitive once you factor in the infrastructure you'd otherwise manage yourself.
- The embedded analytics use case is where Metabase really differentiates -- SaaS companies can ship customer-facing dashboards without building a reporting layer from scratch.
- Advanced features (SSO, sandboxing, white-labeling, caching, staging environments) are locked to paid tiers, which can surprise teams who start on the open-source version.
Metabase launched in 2014 with a simple premise: business intelligence tools were too hard for the people who actually needed them. Tableau required training. Looker required a data team. Most companies ended up with a data analyst fielding an endless queue of "can you pull this for me?" requests. Metabase's answer was a clean, approachable interface where a product manager or customer success rep could answer their own questions without writing a line of SQL.
That positioning has held up well. The company has raised over $100 million in funding and grown to serve companies across the spectrum -- from two-person startups running Metabase on a $5 VPS to enterprises embedding it into customer-facing SaaS products. The GitHub repository sits at 48,100+ stars, making it one of the most starred BI projects in existence. The open-source edition is licensed under AGPL, with a commercial license available for embedding and hosting use cases.
The target audience has always been the "everyone else" in a data organization -- the people who need answers but aren't data engineers. But Metabase has also become a serious tool for data teams who want to give their organizations self-serve access without babysitting every query.
Key features
Visual query builder
The query builder is the heart of Metabase for non-technical users. You pick a table, add filters, choose how to group results, and select a visualization -- all through a point-and-click interface. It handles joins, aggregations, and custom expressions without requiring SQL knowledge. In practice, it covers maybe 80% of the questions a typical business user wants to answer. The remaining 20% -- complex multi-step transformations, window functions, anything requiring real SQL logic -- requires dropping into the SQL editor.
Metabot AI (natural language querying)
The most recent versions of Metabase include Metabot, an AI assistant that lets you ask questions in plain English. "Show me revenue by country for last quarter" becomes a chart without touching the query builder. You can bring your own Anthropic API key, or use Metabase's AI service at $3.75 per million tokens. The quality of results depends heavily on how well your semantic layer is configured -- if your tables have good descriptions and your metrics are defined, Metabot is genuinely useful. If your schema is a mess of cryptic column names, it struggles. Metabase also added MCP (Model Context Protocol) support in version 60, letting you connect external AI tools directly to your Metabase instance.
Data Studio and semantic layer
Data Studio is Metabase's answer to the "single source of truth" problem. You define metrics once -- revenue, churn rate, active users -- and those definitions propagate everywhere. Anyone querying data gets the same calculation, not their own interpretation of it. The dependency graph is a standout feature: you can see exactly which dashboards and questions depend on a given model or metric, so you know what breaks before you change something. This is the kind of thing that sounds boring until you've spent an afternoon tracking down why two dashboards show different numbers.
Interactive dashboards
Dashboards in Metabase support filters, click-through drilldowns, and cross-filtering between charts. You can combine charts with text blocks in "Documents" for narrative context. Subscriptions let you schedule dashboard snapshots to email or Slack on a schedule. Alerts fire when a metric crosses a threshold. The dashboard editor is drag-and-drop and genuinely easy to use -- no configuration files, no YAML.
Embedded analytics
This is where Metabase earns its keep for SaaS companies. You can embed dashboards or individual charts into your product using iframes (fast, simple) or the React SDK (more control, better customization). The SDK supports white-labeling, dynamic theming, and granular permission controls so each customer only sees their own data. Multi-tenant data sandboxing -- where the same dashboard shows different data depending on who's logged in -- is a paid feature but works well once configured. Companies like Cal.com use this to give their users analytics without building a reporting layer from scratch.
SQL editor with model support
For users who do know SQL, Metabase's SQL editor is solid. You can write raw queries, reference saved questions as CTEs, and save results as "models" that other users can query through the visual interface. This creates a useful workflow: a data analyst writes the complex SQL once, saves it as a model, and then non-technical teammates can filter and explore it without touching the underlying query.
Data source connectivity
Metabase connects to 20+ data sources out of the box: PostgreSQL, MySQL, BigQuery, Snowflake, Redshift, MongoDB, ClickHouse, Databricks, DuckDB, Microsoft SQL Server, and more. CSV uploads are supported for ad hoc analysis. Google Sheets integration is available. The breadth of connectors is genuinely impressive for an open-source tool -- you're unlikely to hit a wall unless you're using something very niche.
Usage analytics and administration
Paid tiers include usage analytics that show which dashboards are actually being viewed, which queries are running, and who's downloading data. This is more useful than it sounds -- most BI deployments accumulate dozens of abandoned dashboards, and having visibility into what's actually used helps teams clean house. Staging environments let you test changes before pushing to production, which matters when dashboards are customer-facing.
Caching
Result caching and model caching let Metabase store query results and serve them without hitting the database on every load. For dashboards with heavy queries or high traffic, this makes a real difference in perceived performance. Configuration is per-question or per-dashboard, with TTL settings. No external cache infrastructure required.
Who is it for
Metabase fits best at companies where the data team is small (or nonexistent) but the need for data access is broad. A 20-person SaaS startup where the CTO is also the de facto data person, and where product managers, customer success, and sales all need to pull their own numbers -- that's the sweet spot. The open-source edition is free and can be running in minutes with Docker, which makes it easy to try without a procurement process.
For SaaS companies building customer-facing analytics, Metabase's embedded analytics tier is a serious option. The alternative -- building a custom reporting layer -- typically takes months of engineering time. Metabase's React SDK and iframe embedding let a small team ship something credible in days. Companies in this situation are usually at Series A or later, have 10,000+ end users who want data visibility, and don't want to maintain a custom BI stack.
Data teams at mid-size companies (50-500 employees) also use Metabase as the "last mile" delivery layer -- dbt or Fivetran handles the transformation pipeline, and Metabase sits on top for exploration and dashboards. In this setup, Data Studio's semantic layer and model support make Metabase more than just a visualization tool.
Who should look elsewhere: if your analysts live in SQL and need complex calculated fields, table calculations, or advanced statistical functions, Metabase will feel limiting. Looker or Tableau handle those use cases better. If you need pixel-perfect report design for executive presentations, Metabase's dashboard editor isn't built for that. And if your organization is heavily invested in Microsoft's ecosystem, Power BI's native integration with Azure and Office 365 is hard to beat.
Integrations and ecosystem
Metabase's integration story is primarily about data sources rather than third-party SaaS tools. The 20+ supported databases cover most production stacks. On the output side:
- Slack: Dashboard subscriptions and alerts can post to Slack channels
- Email: Scheduled reports and threshold alerts via SMTP
- Google Sheets: Supported as a data source
- SSO providers: SAML, LDAP, JWT, and Google OAuth for authentication (paid tiers)
- MCP (Model Context Protocol): Connect external AI tools to Metabase as of version 60
- Looker Studio / Google Data Studio: Not a native integration, but data can be exported
The REST API is available and reasonably well-documented. You can programmatically create questions, manage users, and trigger dashboard refreshes. The React SDK for embedded analytics is the most developer-facing part of the product and has improved significantly over the past year.
There's no native Zapier or Make integration, which means automating workflows based on Metabase data requires custom API work. Export options include CSV, Excel, and JSON for query results.
The open-source community has produced a number of third-party drivers and plugins, though the quality varies and some lag behind the main release.
Pricing and value
Metabase's pricing has three main tracks:
Open source (free, self-hosted) The AGPL-licensed edition includes the visual query builder, SQL editor, dashboards, alerts, subscriptions, and now AI features (bring your own LLM key). This is a genuinely complete product for internal analytics. The main things missing are SSO, advanced permissions, white-labeling, and official support.
Metabase Cloud (managed hosting) Starts at roughly $500/month for a production-grade setup when you account for the infrastructure Metabase Cloud replaces (load balancer, managed database, SMTP, high-availability servers). Metabase's own comparison puts the equivalent self-hosted infrastructure cost at $112+/month minimum, so the cloud premium is real but not outrageous given the operational overhead it eliminates. Exact pricing scales with usage and features.
Pro and Enterprise (paid tiers) These unlock SSO integration, data sandboxing for multi-tenant setups, white-labeling for embedded analytics, advanced caching, staging environments, usage analytics, and priority support. Enterprise pricing is custom and typically involves a sales conversation.
AI features If you use Metabase's AI service rather than your own API key, it's $3.75 per million tokens. For most teams, bringing an Anthropic key is the more economical path.
Compared to Tableau (which starts at $75/user/month) or Looker (enterprise pricing, typically $3,000+/month), Metabase is significantly cheaper for teams that don't need the advanced features those tools offer. The open-source edition has no real equivalent in the commercial BI space -- Grafana is the closest, but it's more focused on operational metrics than business analytics.
Strengths and limitations
What Metabase does well
- The open-source edition is genuinely useful, not a crippled demo. You can run a real analytics operation on it without paying anything.
- Time to first dashboard is measured in minutes, not days. The Docker setup works, the UI is intuitive, and non-technical users can actually use it without training.
- Embedded analytics is a strong differentiator. The React SDK and iframe options give SaaS teams a credible path to customer-facing analytics without building from scratch.
- Data Studio's dependency graph and semantic layer are genuinely useful for data teams managing complex models -- this is a feature that tools costing 10x more don't always have.
- The breadth of data source connectors is hard to match in the open-source space.
Honest limitations
- Advanced analytics capabilities are limited. Window functions, complex table calculations, and statistical analysis require dropping into SQL. Tableau and Looker handle these natively in their visualization layers.
- The gap between the open-source edition and paid tiers is significant. SSO alone is a paid feature, which means any company with security requirements will need to pay. Teams that start on the free tier sometimes feel surprised by what's behind the paywall.
- Performance at scale can be uneven. Very large datasets or complex queries can make dashboards slow, and the caching options (while helpful) require paid tiers. Metabase is not a data warehouse -- it queries your existing database, so performance depends heavily on your underlying infrastructure.
Bottom line
Metabase is the right choice for teams that want real analytics without a six-month implementation project. The open-source edition is a legitimate starting point for startups and small teams, and the paid tiers make sense for companies embedding analytics into their products or needing enterprise security controls. The combination of ease of use, open-source availability, and a credible embedded analytics story makes it hard to beat in its price range.
Best for: SaaS companies that need customer-facing analytics, and internal teams that want self-serve BI without hiring a data engineer to maintain it.
Tags:
Frequently asked questions
Is Metabase really free?
How does Metabase compare to Tableau or Looker?
Can I embed Metabase dashboards in my SaaS product?
What databases does Metabase connect to?
How much does Metabase Cloud cost?
Does Metabase require SQL knowledge?
Similar and alternative tools to Metabase