Key takeaways
- "AI search tool" means two different things: APIs that give your product web search (Exa, Tavily, Firecrawl, Brave, Serper), and platforms that tell you how ChatGPT, Gemini or Perplexity talk about your brand. Startups building dashboards usually need both.
- Pick the data source first and the visualization layer second. A cheap search API plus Metabase or Grafana beats a fancy AI dashboard builder sitting on thin data.
- Store the model name, retrieval version and timestamp with every row. Citation counts per engine are unstable, so trend lines beat snapshots.
- Check pricing per 1,000 searches and the free tier before you commit. The spread runs from about $0.30 to $75+ per thousand in the vendor figures below.
- If you want AI visibility data over an API or MCP server instead of building collectors yourself, platforms like Promptwatch expose that data, and you build the views on top.
What people mean by AI search tools with open APIs
The phrase is slippery. Search around and you find three product categories mashed together.
The first is web search APIs for AI apps. You send a query, you get ranked results, snippets or full page content back as JSON or Markdown. These feed agents, RAG pipelines and research features inside your product.
The second is AI visibility platforms. They run prompts against ChatGPT, Gemini, Perplexity and others, then report whether your brand was mentioned, cited or recommended. Those are the numbers a marketing dashboard wants.
The third is dashboard builders: the layer where charts live. Some have AI prompt-to-chart features, some are open source, some are internal-tool builders.
A startup building its own dashboard picks one from each bucket. This guide walks through them in that order, then shows how they fit together.
Part one: web search APIs you can build on
Microsoft retired the Bing Search APIs in August 2025, according to Firecrawl's comparison, and that pushed a lot of developers toward the alternatives below. Worth noting: that article comes from a vendor that ranks itself first, so read the rankings with salt. The pricing table is still useful as a starting point.
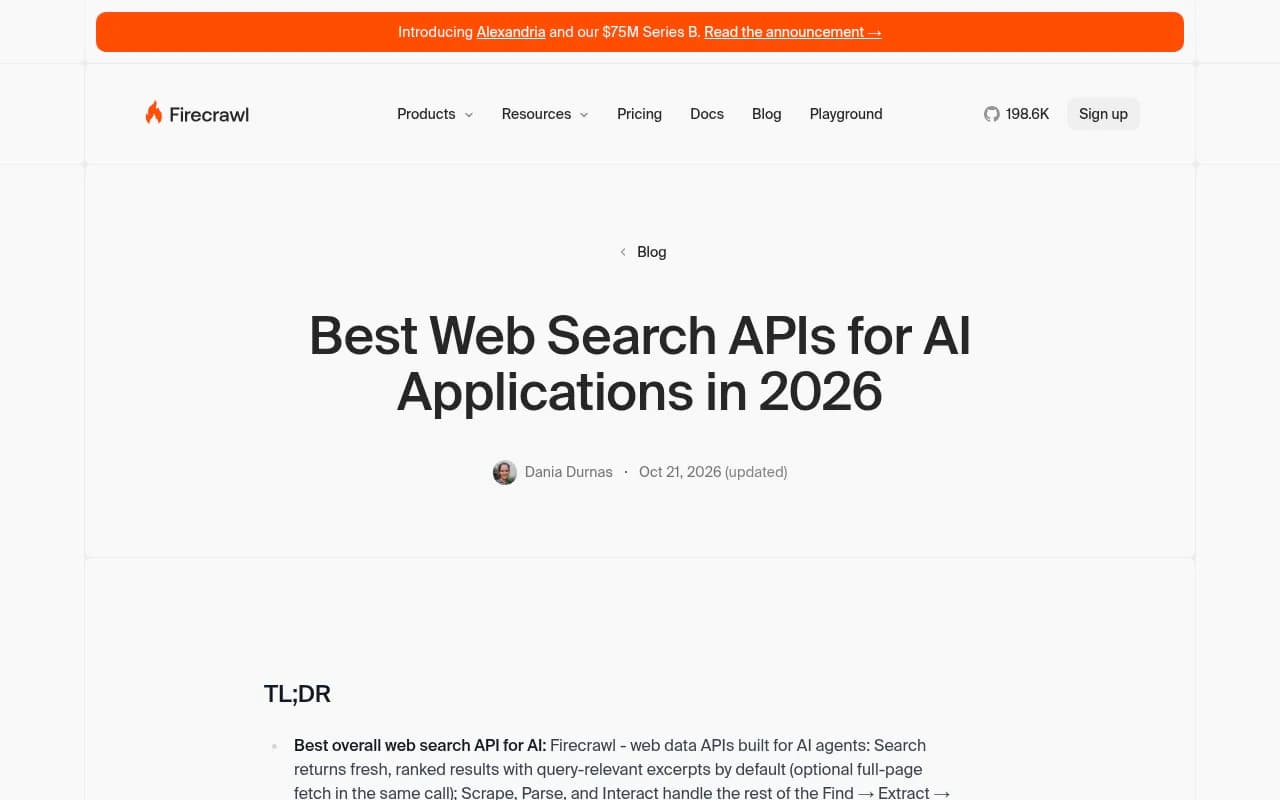
Pricing and free tiers as listed by Firecrawl (updated Oct 21, 2026)
| API | Type | Listed pricing | Free tier |
|---|---|---|---|
| Firecrawl | AI-native | $16/mo billed annually (5K credits) | 1K credits/mo |
| Exa | AI-native, semantic | $7 per 1k searches | $10 credits/month |
| Tavily | AI-native, search plus extraction | $8 per 1k (pay-as-you-go basic) | 1,000/month |
| Parallel AI | AI-native, objective-based | $1-5 per 1k | 5,000 requests/month |
| SerpAPI | Traditional SERP | $75+ per 5k searches | 250/month |
| ScrapingDog | Traditional SERP | $0.29-1.00 per 1k | 1,000 credits |
| Serper | Traditional SERP | $0.30-1.00 per 1k | 2,500 at signup |
| Brave | Own index | $5 per 1k queries | $5 credits/month |
Confirm all of this on each vendor's pricing page before you build a budget around it. Prices in this category move quarterly.
What an agent-ready search API needs
Composio's guide to AI search APIs lists six criteria that I think hold up: fresh data, retrieval quality, structured output, speed, source transparency and control (rate limits, domain filters, predictable pricing).
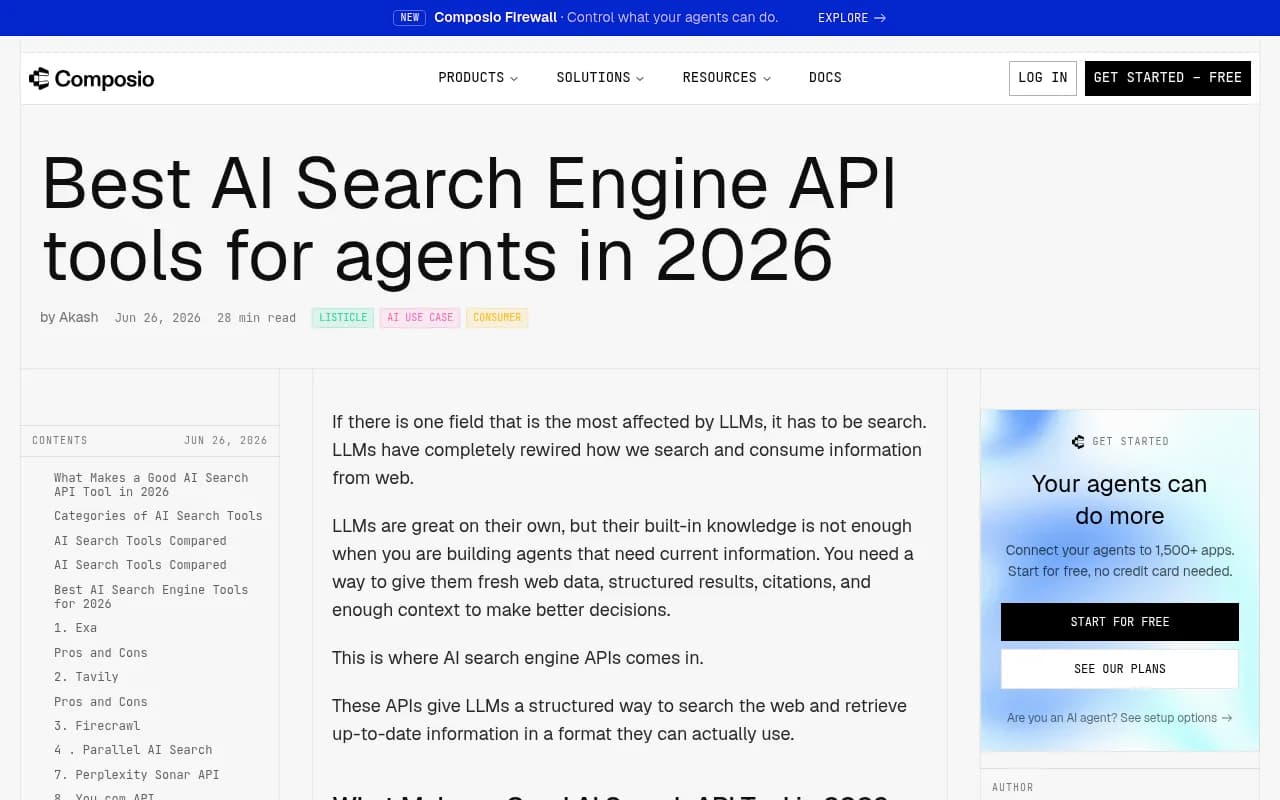
For a dashboard, two of those matter more than the rest. Structured output means you can write rows to a database without a cleaning step. Source transparency means every number on your chart can be traced to a URL when a customer asks "where did this come from?"
Output formats matter more than you think
Per Firecrawl's comparison, the AI-native APIs return JSON plus extras: Firecrawl gives JSON, Markdown, HTML and screenshots, Exa returns JSON with page summaries, Tavily adds citations and key-content extraction, Parallel includes provenance. The traditional SERP APIs return metadata only. That is fine if you are tracking rankings, and not enough if you want to summarize page content on a card.
Firecrawl also claims 678 tokens per query in OpenBenchmarks' October 2026 run, lower than Exa, Brave's LLM Context, Tavily, Parallel or Linkup. Token efficiency is a real cost lever once an LLM reads every result, though a vendor-cited benchmark deserves a quick replication on your own queries.
Which one to start with
- Want semantic, research-style retrieval: try Exa.
- Want search plus page extraction in one vendor with citations: Tavily or Firecrawl.
- Want Google-like SERP data at the lowest cost per thousand: Serper or ScrapingDog.
- Want an independent index: Brave.
- Want a big free allowance for prototyping: Parallel (5,000 requests/month) or Serper (2,500 at signup).
Prototype with two of them on the same 50 queries and compare results by hand. It takes an afternoon and saves you from a painful migration later.
Part two: AI visibility data through an API
If your startup is a marketing, SEO or analytics product, your dashboard probably needs to answer "how do AI engines represent a brand?" You can build collectors yourself by calling model APIs, but you quickly hit three problems. API answers can differ from what users see in the real chat interfaces. Citations vary by model. And running thousands of prompts daily across countries is a project in itself.
This is the case for buying the data layer and building the views yourself.
Promptwatch is an AI visibility and GEO platform that monitors the real interfaces of ChatGPT, Google AI Overviews, Google AI Mode, Gemini, Perplexity, Copilot and others, and exposes the data through a REST API v2 and a hosted MCP server with 110+ read and write tools. The API covers visibility, prompts, responses, citations, sentiment, crawler and visitor analytics, with date ranges up to 92 days so a quarter fits in one request. Its API and MCP docs list the endpoints, and the integrations page shows the Looker Studio connector and Slack options. API and MCP access is included on every plan, and the prices and request limits are on promptwatch.com/pricing.
I would be wary of any claim that one vendor is "the answer" here, so compare. The directory at bestgeosoftware.com lists GEO platforms, and the catalog has other trackers worth a look, such as [tool:profound] and [tool:otterly-ai]. I have not verified their API terms for this guide, so check what each exposes before choosing: read endpoints, rate limits, export formats and whether raw responses come back or only scores.
Design for unstable numbers
Promptwatch Data's Average Sources Per Response report shows why your schema matters. ChatGPT cites about 5 sources per web-search answer, Google AI Overviews about 10, and Perplexity almost exactly 10, day after day. Microsoft Copilot's average swung from under 2 to nearly 17 within a few weeks, then settled at the low end. Related reports on ChatGPT query fanouts and the citation drop after GPT-5.3 show that model updates move the baseline.
The practical consequence for a dashboard: if you chart "citations per answer" without recording which model and retrieval version produced it, a vendor-side change will look like a performance change on your side. Store model, version, engine, country and timestamp on every row. Draw trend lines, annotate known model releases, and avoid single-day snapshots in executive views.
Part three: the dashboard layer
Now the charts. Bruin's roundup (a vendor source, since Bruin sells a competing product) groups AI dashboard tools into three styles: question-and-answer layers that replace dashboards, tools that auto-generate dashboards from a prompt, and traditional BI suites with AI bolted on. Its shortlist includes Bruin, ThoughtSpot, Hex, Power BI Copilot, Looker with Gemini, Basedash, Omni, Tableau Pulse and Dot. It says Basedash suits startups wanting prompt-to-dashboard without a big BI rollout, and that ThoughtSpot and Looker fit teams with a mature semantic layer.
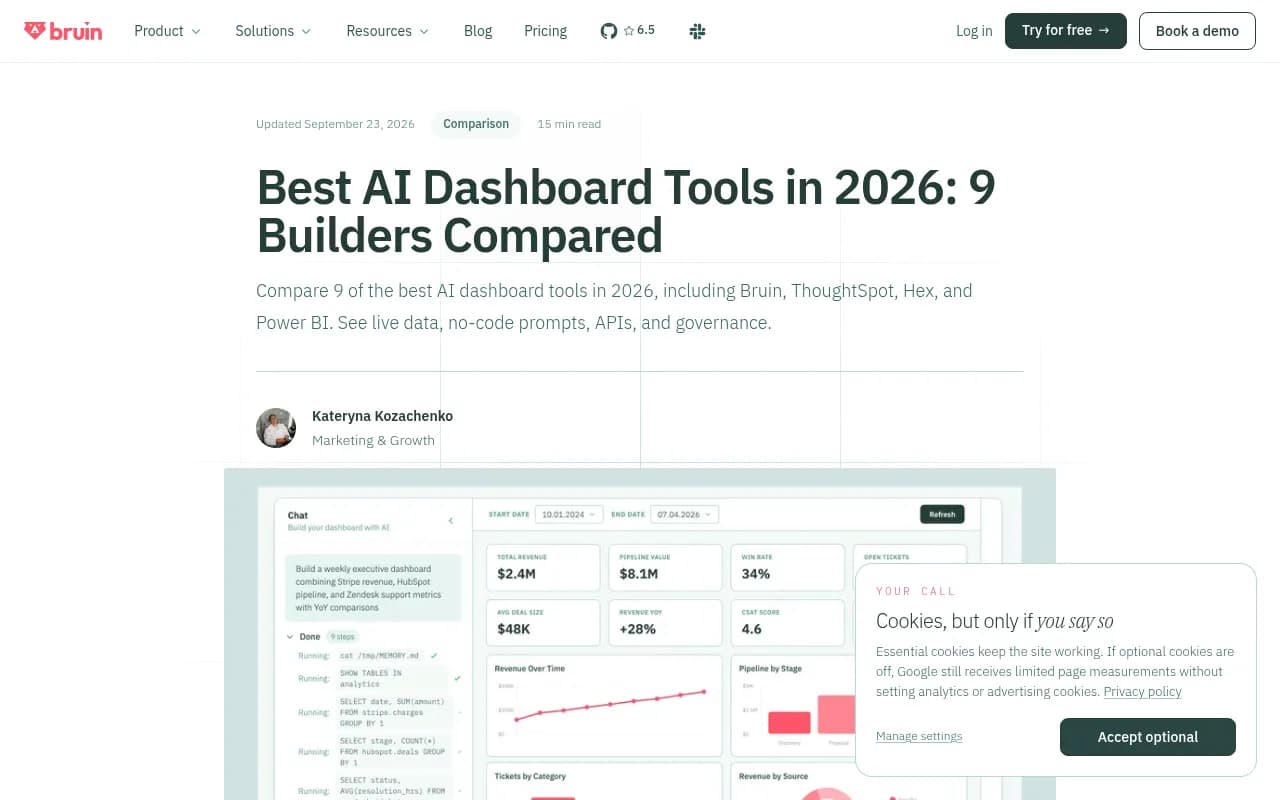
I have not verified dashboard pricing for these, so treat the table below as orientation, not a buying guide.
| Tool | Style | Why a startup might pick it |
|---|---|---|
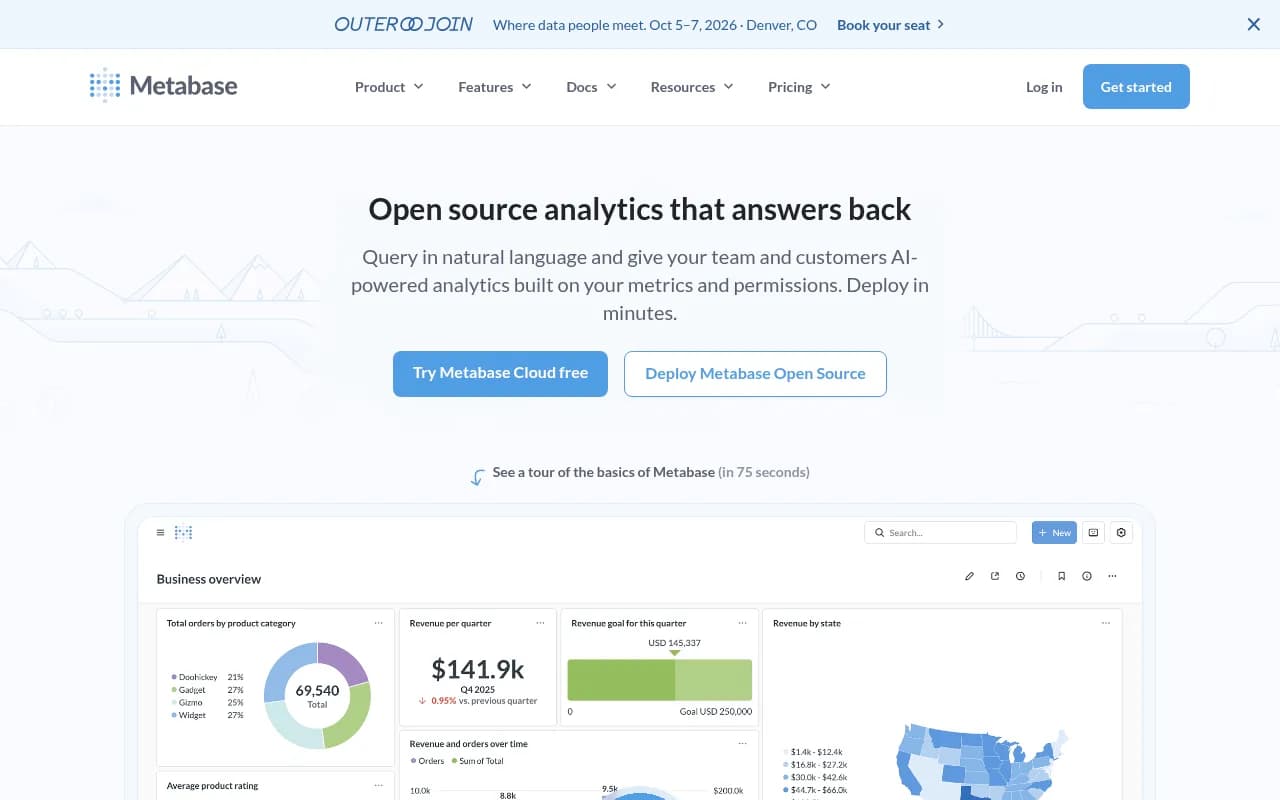
| Metabase | Open-source BI | Fast to stand up, friendly for non-technical teammates |
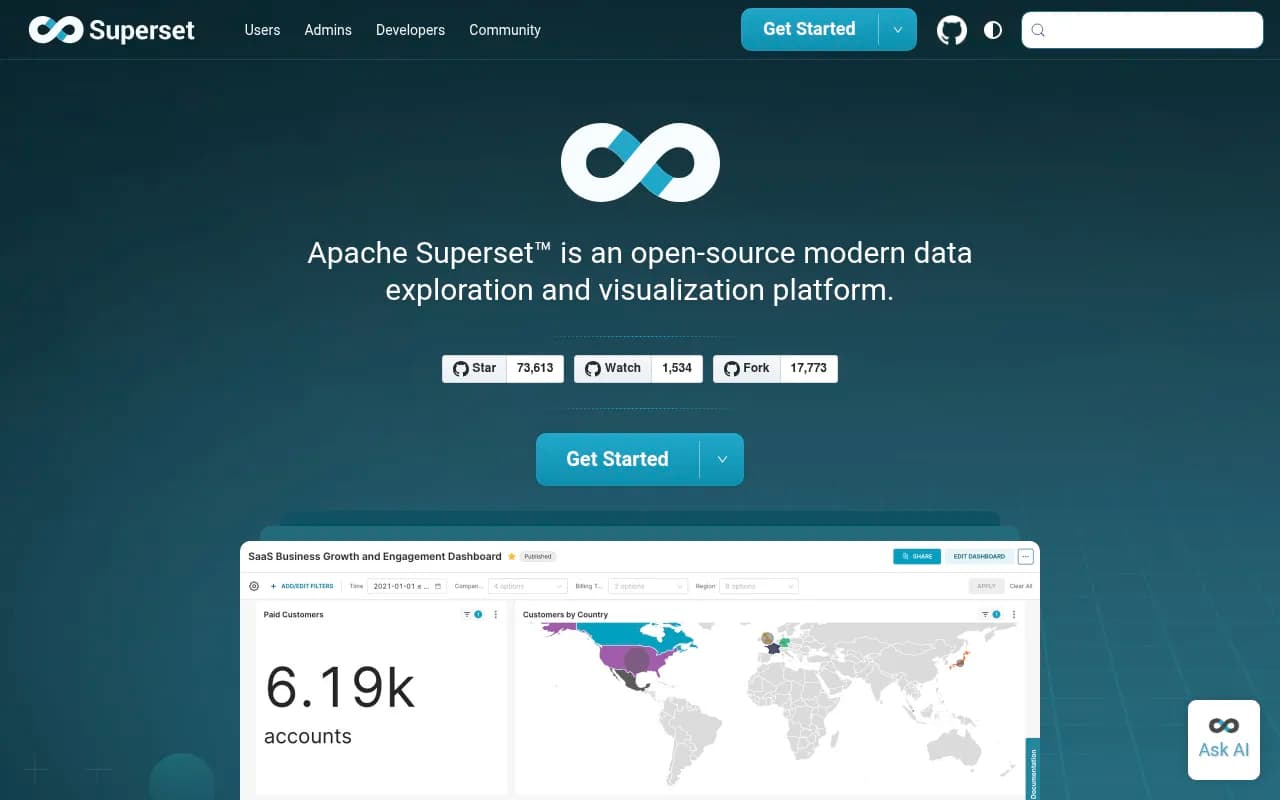
| Apache Superset | Open-source BI | Flexible, heavier to operate |
| Grafana | Open-source observability and charts | Great for time series and trend lines |
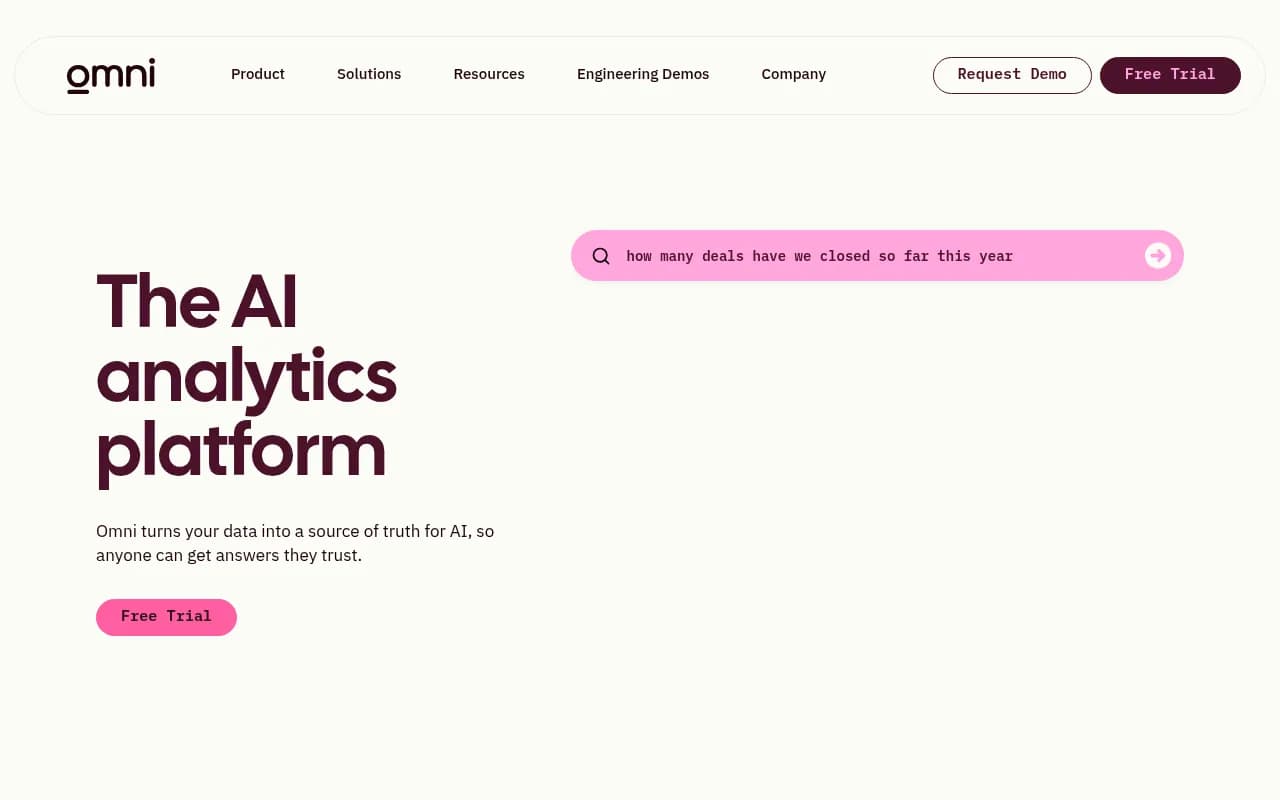
| Omni | Modern BI | Built for data teams and analysts |
| Microsoft Power BI | Traditional BI with Copilot | Already in a Microsoft shop |
| Tableau | Traditional BI | Mature visualization, enterprise feel |
| Retool | Internal-tool builder | Connect any database, API or LLM and build custom UI |


Build versus embed
If the dashboard is internal, Metabase or Grafana on top of Postgres is usually enough, and it is cheap. If the dashboard is a customer-facing product feature, you will want your own front end (Next.js plus a charting library) reading from your own API, with the BI tool kept for internal analysis. Trying to resell a BI tool's UI to customers is where startups get stuck on licensing and branding.
A reference architecture that works
Here is the setup I would sketch for a small team:
- Collectors. A scheduled job calls your chosen search API (for product features) and the AI visibility API (for brand data). Use n8n or a plain cron worker.
- Raw store. Write every response, with model, version, engine, country and timestamp, into Postgres or BigQuery. Keep raw JSON in a column. You will want to reprocess later.
- Transform. Compute share of voice, average position and citation counts in SQL views. Keep definitions in one place.
- Serve. Expose a thin internal API that your front end and BI tool both call, so the numbers never disagree.
- Visualize. Metabase or Grafana internally; custom charts for customers.
- Alert. Push anomalies to Slack. A visibility drop that coincides with a model update should say so in the message.
For a sample of what a first version of the collector might look like:
import requests, datetime, json

def fetch_search(query):
    r = requests.post(
        "https://api.example-search.com/v1/search",
        headers={"Authorization": "Bearer KEY"},
        json={"query": query, "max_results": 10},
        timeout=20,
    )
    r.raise_for_status()
    return r.json()

row = {
    "query": "best crm for startups",
    "provider": "example-search",
    "fetched_at": datetime.datetime.utcnow().isoformat(),
    "payload": json.dumps(fetch_search("best crm for startups")),
}
The endpoint is a placeholder. Swap in the real URL and parameters from your provider's docs.
Using MCP to skip some of the plumbing
A newer option: if the data vendor exposes an MCP server, you can let an assistant query it and even build dashboards conversationally. Promptwatch's hosted MCP server works with Claude, Claude Code, ChatGPT, Cursor and Lovable, and its MCP integration page explains the one-click OAuth or API key setup. Firecrawl offers a keyless MCP endpoint at https://mcp.firecrawl.dev/v2/mcp, free within a daily per-IP cap, which is handy for trying search before you create an account.
I like MCP for exploration and prototyping. I would not run a customer-facing dashboard on live MCP calls. Pull data on a schedule into your own store, then query that.
Evaluation checklist before you commit
- Does the API return raw responses and citations, or only a pre-computed score?
- What are the rate limits per hour, and what happens when you exceed them?
- Can you export historical data, or is it locked inside the vendor?
- Is the data collected from real user interfaces or only from model APIs? The answers can differ.
- What does a quarter of history cost in requests?
- Are terms of use friendly to storing and displaying data to your own customers?
- Is there a free tier or trial for a realistic pilot?
That last question matters. Many vendors give you a small free allowance and then step up sharply. Run a two-week pilot with your actual query volume before you sign anything annual.
Mistakes I see startups make
Starting with the dashboard builder. A prompt-to-dashboard tool is impressive in a demo, but if the data underneath is thin or inconsistent, you get confident charts of garbage.
Ignoring cost per thousand. Search costs look trivial at 100 queries. At 50 prompts times 5 engines times daily runs times customers, it adds up fast. Do the multiplication early.
Mixing metrics definitions. If "visibility" means one thing in the BI tool and another in the product, trust erodes. Define once, in SQL.
No provenance. Every chart should be drillable to a response and a source URL. Customers will ask.
Where to explore more
For wider browsing, the software directory at surferstack.com covers adjacent categories, and the AI rank tracking directory lists trackers if you want to compare data providers side by side.
If you are an agency or brand rather than a startup building a product, and you would rather have specialists run the AI visibility work, 1001 SEO Media handles GEO and technical SEO and works with Promptwatch for AI visibility tracking.
Bottom line
Pick the search API by cost per thousand and output format, pick the AI visibility data source by what its API actually returns, and keep the dashboard layer boring. Metabase or Grafana over Postgres, with model and version stored on every row, will serve a small team better than the shiniest AI dashboard builder. Start with a two-week pilot on 50 real queries, measure the cost, and only then widen the scope.