Apache Superset Review 2026
An open-source BI platform supporting SQL queries, interactive dashboards, and a wide range of chart types. Connects to most modern databases and data warehouses.
Key takeaways
- Completely free and open source under the Apache 2.0 license -- no per-seat fees, no paywalled features
- Connects to 60+ databases and data warehouses out of the box, from SQLite and DuckDB to Snowflake, BigQuery, and Databricks
- Offers both a no-code drag-and-drop chart builder and a full SQL IDE (SQL Lab), making it usable by analysts and engineers alike
- Self-hosting requires real infrastructure work -- not a tool you spin up in five minutes without DevOps experience
- Preset.io offers a managed cloud version if you want Superset without the operational overhead
Apache Superset started life inside Airbnb's data engineering team around 2015, originally called Caravel. It was donated to the Apache Software Foundation in 2017 and graduated to a top-level Apache project in 2021. That trajectory matters: this isn't a startup's side project. It's a mature, battle-tested platform with thousands of production deployments, a large GitHub community (consistently one of the most-starred BI projects on GitHub), and a governance structure that means it's not going anywhere.
The tool sits in the business intelligence and data exploration space, competing with Metabase, Redash, Grafana (for certain use cases), and commercial tools like Tableau and Power BI. Its core pitch is straightforward: give data teams a self-hosted, SQL-native analytics platform that doesn't cost anything in licensing fees. For organizations with the engineering capacity to run it, that's a genuinely compelling offer.
Preset, Inc. -- founded by Superset's original creator Maxime Beauchemin -- offers a managed cloud version of Superset with a free Starter tier (up to 5 users) and paid plans in the $25-35/user/month range. This is worth knowing because it gives teams a path to Superset without the self-hosting burden.
Key features
SQL Lab -- the built-in SQL IDE
SQL Lab is one of Superset's strongest selling points. It's a full-featured SQL editor with multi-tab support, query history, database metadata browsing, and result set export. You can write queries against any connected database, preview schemas and table structures in a sidebar, and save queries for reuse. Jinja templating support means you can parameterize queries with variables, which is useful for building reusable query templates or injecting user-level filters dynamically. The async query execution model means long-running queries don't block the UI. Compared to Metabase's SQL editor, SQL Lab is noticeably more capable -- it feels closer to a lightweight DBeaver than a basic query box.
No-code chart builder (Explore)
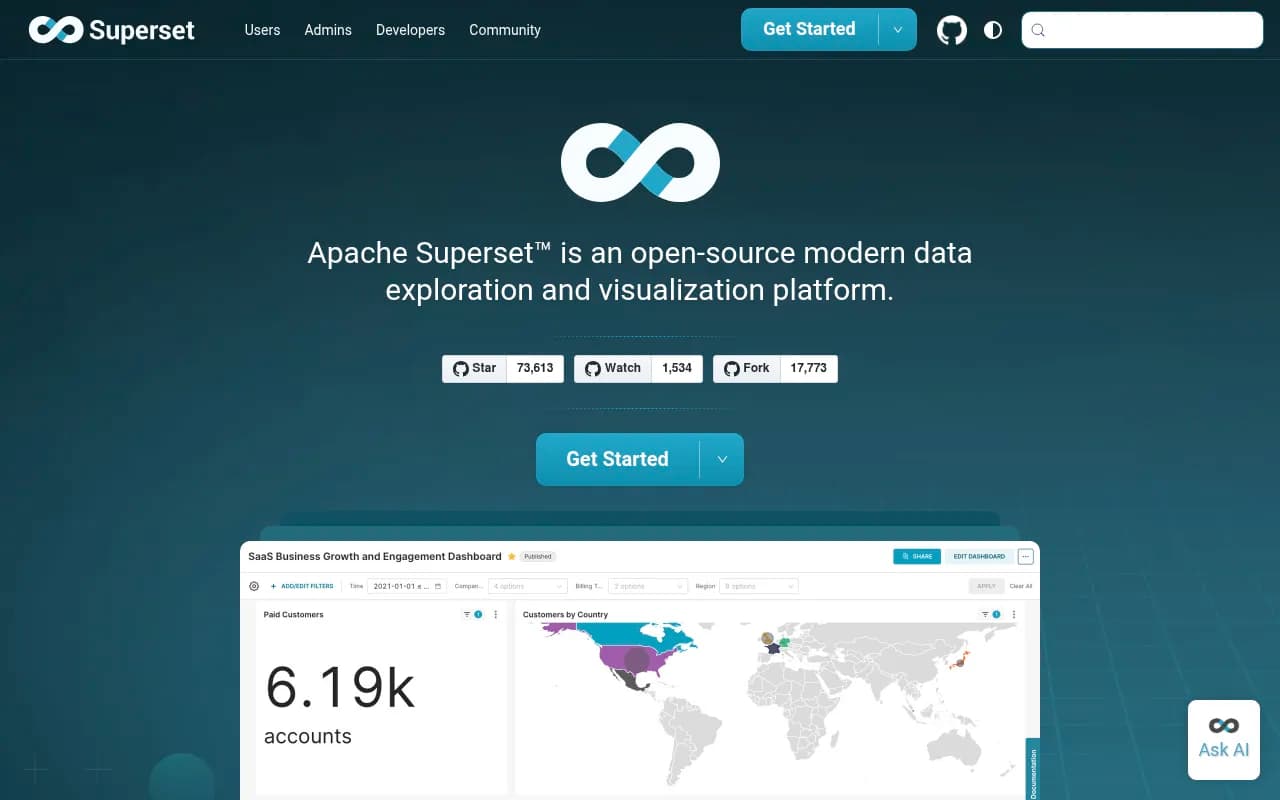
The Explore interface lets analysts build charts without writing SQL. You pick a dataset, choose a chart type, and drag dimensions and metrics into the appropriate slots. It handles aggregations, time grain selection, filters, and sorting through a point-and-click interface. The experience is reasonably intuitive for someone familiar with BI tools, though the sheer number of configuration options can feel overwhelming at first. This is where Superset's 40+ pre-installed chart types come into play -- bar charts, line charts, scatter plots, pie charts, heatmaps, sunbursts, treemaps, Sankey diagrams, geospatial maps (using Deck.gl), and more.
Dashboard builder
Dashboards in Superset are assembled from saved charts. You drag charts onto a canvas, resize them, and arrange them into a layout. The dashboard builder supports:
- Cross-filtering: clicking a data point in one chart filters other charts on the same dashboard
- Drill-to-detail: clicking into a chart to see the underlying row-level data
- Drill-by: pivoting a chart's dimension on the fly without leaving the dashboard
- Native filters: dropdown, range, and date filters that apply across multiple charts
- Jinja-templated URL parameters for embedding and sharing filtered views
The cross-filtering behavior in particular is something that took Superset a while to get right, and it now works well for most chart types. It's not quite as polished as Tableau's filter actions, but it's functional and free.
Dataset and semantic layer
Superset has a lightweight semantic layer built around datasets. A dataset can be a physical table or a virtual dataset (essentially a saved SQL query treated as a table). Within a dataset, you can define calculated columns, metrics with custom SQL aggregations, and certification status. This gives you a shared definition of metrics that multiple charts can reference -- useful for keeping "Monthly Active Users" consistent across a dozen dashboards. It's not as sophisticated as dbt's semantic layer or Looker's LookML, but it covers the basics well.
Database connectivity
The database support list is genuinely impressive. Superset connects to everything from SQLite and DuckDB for local development to enterprise systems like Oracle, SAP HANA, IBM DB2, and Teradata. Cloud data warehouses -- BigQuery, Snowflake, Redshift, Databricks, Azure Synapse, ClickHouse -- are all supported. The connection mechanism uses SQLAlchemy under the hood, which means any database with a SQLAlchemy dialect can theoretically work. Each database has its own driver installation requirements, which is one of the friction points in self-hosted deployments.
Caching and performance
Superset uses a configurable caching layer (Redis is the standard choice) to cache query results and dashboard data. You can set cache timeouts at the dataset, chart, or dashboard level. For dashboards with expensive queries, this is essential -- without caching, every dashboard load hits the database directly. The caching setup requires Redis configuration during deployment, which adds operational complexity but is well-documented.
Role-based access control (RBAC)
Superset has a fairly granular permission system. You can define roles that control access to specific databases, datasets, charts, and dashboards. Row-level security (RLS) lets you filter data based on the logged-in user's attributes -- useful for multi-tenant deployments where different users should see different subsets of data. The RBAC system is powerful but complex to configure correctly, and it's one of the areas where teams most often run into trouble during initial setup.
Plugin architecture and extensibility
Superset's visualization layer is built on a plugin system. The 40+ built-in chart types are themselves plugins, and you can build custom chart types using the same framework (based on Apache ECharts and Deck.gl). This is a real differentiator for engineering teams that need visualizations beyond what's available out of the box. The REST API is comprehensive enough to support embedding dashboards in external applications, triggering cache refreshes, and managing resources programmatically.
Alerts and reports
Superset can send scheduled email and Slack reports with chart or dashboard screenshots attached. It also supports threshold-based alerts -- if a metric crosses a defined value, it sends a notification. This feature requires Celery workers and a properly configured email/Slack integration, which again adds to the deployment complexity. When it works, it's genuinely useful for operational dashboards.
Who is it for
Superset is a natural fit for data engineering and analytics teams at mid-size to large companies that have existing data infrastructure and the DevOps capacity to run a self-hosted application. Think: a 10-50 person data team at a tech company that already runs Kubernetes, has a data warehouse on Snowflake or BigQuery, and wants to give 50-200 internal users access to self-service analytics without paying Tableau's per-seat licensing fees. The cost savings at that scale are significant.
It also works well for startups that are technically sophisticated but budget-conscious. If you have a backend engineer who can handle the Docker/Kubernetes deployment and ongoing maintenance, Superset gives you a BI platform that would otherwise cost tens of thousands of dollars per year. The Preset managed cloud option lowers the bar further -- the Starter tier (5 users, free) is a reasonable way to evaluate whether Superset fits your workflow before committing to self-hosting.
Data analysts who are comfortable with SQL will get the most out of Superset. SQL Lab is genuinely good, and the ability to move fluidly between writing SQL and building visualizations is a workflow that SQL-native analysts appreciate. Less technical business users can use the no-code Explore interface, but they'll need some onboarding -- the UI is not as immediately intuitive as Metabase or Google Looker Studio.
Who should probably look elsewhere: small teams without DevOps resources, organizations that need embedded analytics with white-labeling out of the box (Superset can do this but it requires significant customization), and teams that need real-time streaming dashboards (Superset is designed for batch/query-based analytics, not sub-second streaming).
Integrations and ecosystem
Superset's integration story is primarily about database connectivity. The 60+ supported databases cover essentially every SQL-based system in common use. Notable connections include:
- Cloud data warehouses: BigQuery, Snowflake, Amazon Redshift, Databricks, Azure Synapse, ClickHouse
- Traditional databases: PostgreSQL, MySQL, Microsoft SQL Server, Oracle, IBM DB2, MariaDB
- Apache ecosystem: Druid, Hive, Spark SQL, Pinot, Kylin, Impala, Phoenix
- Modern OLAP engines: DuckDB, MotherDuck, StarRocks, Apache Doris, Trino, Presto
- Other: Google Sheets (via Shillelagh), Elasticsearch, MongoDB (limited), Cloudflare D1
Beyond databases, Superset integrates with:
- Redis for caching and Celery task queuing
- Celery for async query execution and scheduled reports
- Slack for alert and report delivery
- Email (SMTP) for scheduled reports
- OAuth providers (Google, GitHub, Azure AD, Okta) for authentication via Flask-AppBuilder
The REST API is well-documented and covers most operations: creating/updating charts and dashboards, managing datasets, triggering cache invalidation, and embedding dashboards via guest tokens. The guest token embedding flow is the standard approach for embedding Superset dashboards in external applications.
There's no official mobile app. The web interface is responsive to a degree but is clearly designed for desktop use. Browser extensions don't exist as a concept for this type of tool.
Pricing and value
Apache Superset itself is free. Full stop. The Apache 2.0 license means you can use it commercially, modify it, and distribute it without paying anyone anything. Your costs are infrastructure (servers, managed Kubernetes, etc.) and engineering time for deployment and maintenance.
Preset (managed Superset):
- Starter: Free, up to 5 users, limited to 1 workspace
- Professional: Approximately $25-35/user/month (pricing varies by seat count)
- Enterprise: Custom pricing
For comparison, Tableau Cloud runs around $70-75/user/month for Creator licenses. Power BI Premium Per User is $20/user/month but requires Microsoft 365 infrastructure. Metabase Cloud starts at $500/month for up to 5 users on its Pro plan. Looker (Google) is enterprise-priced and typically starts at $3,000+/month.
At the self-hosted level, Superset's value proposition is hard to beat if you have the engineering capacity. At the managed Preset level, it's competitive with Metabase and significantly cheaper than Tableau or Looker. The main hidden cost is the engineering time required for initial setup, ongoing maintenance, upgrades, and troubleshooting -- which can be substantial.
Strengths and limitations
Superset does several things genuinely well. The database connectivity breadth is unmatched among open-source BI tools -- if you're running an unusual database or a mix of several, Superset almost certainly supports them all. SQL Lab is a legitimately good SQL editor that data analysts will actually want to use. The plugin architecture means the visualization library can grow beyond the 40+ built-ins, and the community has produced a number of useful custom chart types. The RBAC and row-level security system, while complex, is powerful enough for real multi-tenant deployments. And the price (free) is obviously hard to argue with.
The limitations are real, though. Self-hosting Superset is not trivial. The recommended production setup involves Docker Compose or Kubernetes, Redis, Celery workers, a metadata database (PostgreSQL recommended), and careful configuration of feature flags. Teams that underestimate this complexity end up with unstable deployments. The UI, while functional, shows its age in places -- some workflows feel clunky compared to newer BI tools, and the dashboard builder's drag-and-drop can be finicky. Alerts and reports are notoriously tricky to configure correctly, with many GitHub issues and forum threads about emails not sending. Mobile experience is poor. And while the semantic layer is useful, it's not a replacement for a proper metrics layer if your organization needs consistent metric definitions across multiple tools.
Bottom line
Apache Superset is the right choice for data teams that have SQL-heavy workflows, existing data infrastructure, and the engineering capacity to run a self-hosted application -- or for teams willing to pay Preset's managed pricing to avoid the operational burden. It's a mature, capable platform that punches well above its price point (which is zero).
The best single use case: a data engineering team at a mid-size company that wants to give 50-150 internal users self-service access to a Snowflake or BigQuery warehouse, with proper access controls and a shared metric layer, without paying six figures a year in BI licensing fees.
Frequently asked questions
Is Apache Superset really free?
What databases does Apache Superset connect to?
How hard is it to set up Apache Superset?
How does Apache Superset compare to Metabase?
Can I embed Superset dashboards in my application?
Who uses Apache Superset in production?
Similar and alternative tools to Apache Superset