Key takeaways
- On a 0-100 scale, 50 usually means neutral or evenly mixed. On a -1 to +1 scale, the same thing is 0. It is not a bad score by default.
- A 50 can hide two very different situations: all mentions are neutral, or half are glowing and half are hostile. Always check the distribution.
- Scales and formulas differ between tools (Moz uses 1-100, LLM Pulse uses -1 to +1, RankScale uses 0-100), so a 50 in one tool is not a 50 in another.
- Sample size matters more than most dashboards admit. A score built on a handful of mentions is noise.
- Worry about direction, themes, and sudden shifts. Do not worry about a flat 50 on its own.
What an AI sentiment score actually is
An AI sentiment score is a single number that summarizes how positively or negatively a language model talks about something. In brand monitoring, that something is usually your company. A tool sends a set of prompts to ChatGPT, Gemini, Perplexity and others, collects the answers, finds the sentences that mention your brand, classifies each one as positive, neutral or negative, and rolls those classifications into one figure.
That is the whole idea. Everything interesting happens in the details: the scale, the classification method, the aggregation formula, and how many mentions feed the number.
The broader definition from computer science is similar. A sentiment score is a numerical representation of emotional stance extracted from text, usually by identifying positive and negative language and sorting it into positive, neutral and negative buckets (ScienceDirect overview). Older methods used dictionaries of positive and negative words. Newer ones use trained models such as BERT-style classifiers or LLMs that read the whole statement in context.
The type of text matters too. The same word "score" appears in call center software, meeting tools, financial research platforms and AI visibility dashboards, and they do not mean the same thing. I'll cover a few of them below because they make the 50 question much easier to reason about.
So what does a 50 really mean?
Short answer: on a 0-100 scale, it is the midpoint. Midpoint of what depends on the formula.
Take the RankScale definition as one concrete example. Its Sentiment Score runs from 0% to 100% and is calculated as (positive mentions x 1 + neutral mentions x 0.5 + negative mentions x 0) divided by total mentions, times 100. Under that formula:
- 0% means every mention is negative.
- 100% means every mention is positive.
- 50% means either all mentions are neutral, or positives and negatives are balanced.
That last line is the important one. The tool's own documentation says a 50 covers both "a balanced distribution between positive and negative mentions" and "exclusively neutral mentions." Those are very different brand situations.
Here is what that looks like with 100 mentions:
| Scenario | Positive | Neutral | Negative | Score |
|---|---|---|---|---|
| Everything is factual | 0 | 100 | 0 | 50 |
| Polarized | 50 | 0 | 50 | 50 |
| Mostly neutral, a little mixed | 20 | 60 | 20 | 50 |
| Warm and slightly critical | 40 | 40 | 20 | 60 |
Three of those four rows score exactly 50, and only one of them is what most people picture when they hear "neutral." This is the same trap that shows up in customer research: a mean of +0.9 and -0.9 is 0.0, a reading that describes no actual customer (Perspective AI's guide to customer sentiment scoring).
The fix is boring and effective. Never read the score without the mix underneath it.
The scale problem: a 50 is not a 50 everywhere
The research for this guide turned up three AI-visibility tools that publish how they compute sentiment, and they disagree on basics.
| Tool | Scale | How the score works | What neutral looks like |
|---|---|---|---|
| Moz AI Visibility | 1 to 100 | Classifies each brand mention as positive, neutral or negative and turns that into one score. Formula not published. | Not defined publicly |
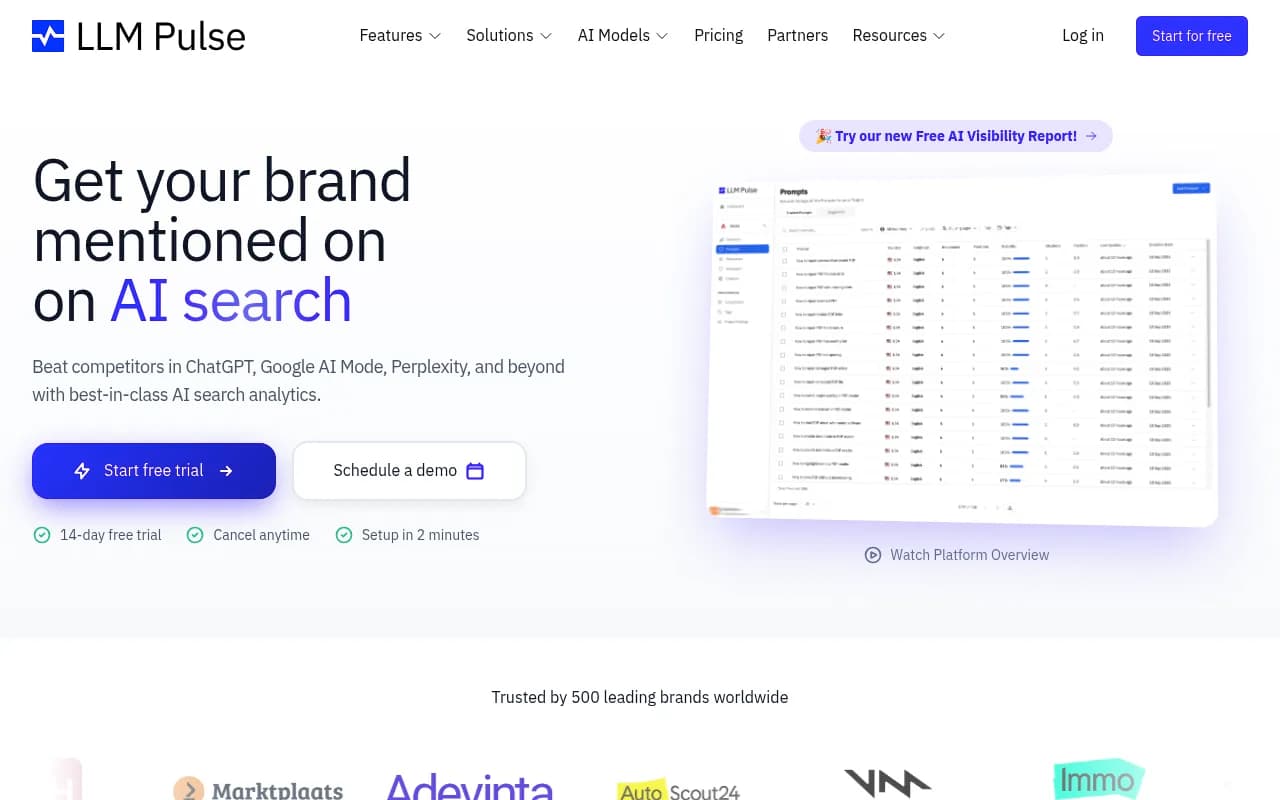
| LLM Pulse | -1 to +1, five levels | Very positive +1.0, positive +0.5, neutral 0.0, negative -0.5, very negative -1.0, plus a net sentiment figure | 0.0 |
| RankScale | 0 to 100 | (positive x 1 + neutral x 0.5) / total mentions x 100 | 50 |
| AlphaSense (for financial transcripts) | -100 to +100 | Percent positive minus percent negative, then normalized across all transcripts | 0 means average, not neutral |
Two things stand out.
First, Moz publishes the 1-100 range and says higher means the brand is discussed more positively, but it does not say what 50 means. If you are using that score, treat 50 as "probably the middle" and verify against the mentions breakdown rather than assuming. On LLM Pulse, neutral is 0 on the native scale. Converting it to a 0-100 range puts the midpoint at 50, but that mapping is my own inference, not something the tool states.
Second, AlphaSense shows how a score can mean something completely different. Its sentiment is normalized so the average across two years of transcripts is zero. A score of 0 means average for the dataset, 40 puts a transcript in the top 20%, and 99 puts it in the top 2%. That is a relative ranking, not a measure of how positive the text is. A 50-style midpoint there tells you nothing about tone.
The practical rule: before you interpret any score, find the tool's documentation page and answer three questions. What is the scale? What is the formula? What does the midpoint represent?
Why sentiment scores in other tools make good analogies
AI visibility tools did not invent this. Several mature products have already worked out how to explain what their numbers mean, and they are worth borrowing from.
Call center sentiment
Genesys Cloud publishes a clear guide to reading its scores. Its sentiment score is a normalized weighted average of sentiment events across a conversation, with more weight on how the customer felt at the end. It also separates score from trend. A 60 is a lightly positive interaction. An 80 is more sustained positivity. A 100 is "extremely rare," a peak emotional experience with no negativity (Genesys Cloud documentation).
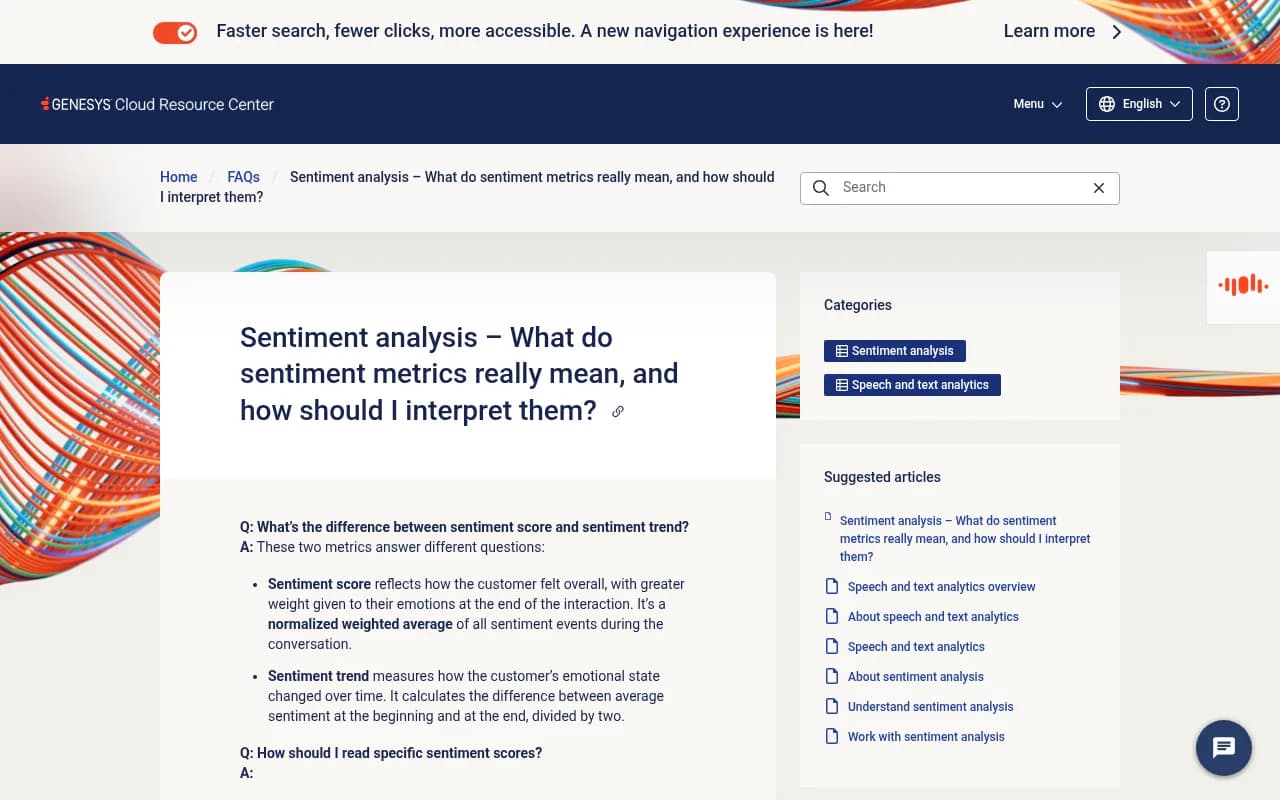
The score-plus-trend pairing is the most useful idea there. Genesys gives an example: a score of 80 with a trend of -20 means the customer started well and declined, so pay attention. The same logic applies to AI search. A steady 50 is a different story from a 50 that was 65 last month.
Meeting sentiment
Read AI scores meetings by combining facial and verbal cues with talk time, and publishes benchmarks: above 80 is good, below 70 is poor (Read Help Center). Notice what happened there. On that tool, a 70 is already a problem, because most meetings score high. Each product has its own distribution, so the same number means different things.
That is exactly why "what is a good sentiment score" has no universal answer. You need the tool's baseline, and ideally your own history and your competitors' scores in the same tool.
What feeds an AI sentiment score
In AI visibility monitoring, the pipeline looks roughly like this:
- You define a set of prompts (for example, "best project management tools for agencies").
- The tool runs them across models on a schedule.
- It finds every mention of your brand in the responses.
- A language model or classifier labels each mention.
- The labels are aggregated into a score, often per prompt, per topic, per model, and overall.
LLM Pulse, for instance, has a language model score each response that mentions or cites the brand, looking at overall tone, specific praise or criticism, and key topics. Mixed statements like "industry leader but pricing prohibitive" get captured as both positive and negative. Moz says it analyzes full statements in context rather than isolated words, and groups mentions into themes with their own scores.
That theme-level breakdown is where the value is. An overall 50 might be a 75 on product quality and a 25 on pricing. The headline hides the story.
Sample size is the quiet problem
A sentiment score is an average over mentions, and the number of mentions can be small. Promptwatch Data's Average Sources Per Response report shows how thin answers can be: ChatGPT cites about 5 sources per web-search answer, while Google AI Overviews and Perplexity sit around 10. If a brand is mentioned in a fraction of answers, you can end up scoring a few dozen sentences a week.
Moz addresses this by attaching a confidence level to each competitor's score, with higher confidence meaning more brand mentions. That is the right instinct. If your tool does not show confidence or mention counts, ask for them before you trust a week-over-week change. A drop from 58 to 49 on 12 mentions is not news.
A related caveat from LLM Pulse's documentation: the dashboard and the API can aggregate differently, so the same date range may show different numbers. And mention rate is computed per model, so a strong aggregate can hide a weak model. If you pull data into your own reports, pick one source and stay with it.
Where AI sentiment scores mislead
A few failure modes come up again and again.
- Averaging hides polarization. Covered above. Always look at the positive, neutral and negative counts, not just the headline.
- Sarcasm and negation. Classifiers still misread irony. In AI answers this is rarer than in tweets, because models usually write in a measured register, but quoted reviews inside an answer can still trip things up.
- Neutral is not harmless. If every mention is neutral, AI describes you as a factual option without enthusiasm. In a recommendation context, that can mean you are listed but never preferred.
- Positive is not the same as visible. Sentiment is scored on the mentions that exist. A brand mentioned twice, warmly, can score higher than a brand mentioned 200 times with some criticism. Read sentiment next to share of voice and visibility.
- Context collapse. A number tells you feeling moved. It does not tell you why. You need the underlying claims and the pages the model drew them from.
- Different prompts, different scores. A prompt like "is Brand X worth it?" invites evaluation. "What is Brand X?" invites description. Mix them without tagging and your score will wander.
When to worry
A flat 50 is not an emergency. These patterns are.
Worry about direction
A sustained decline over several weeks, across more than one model, with a healthy number of mentions behind it. One model dropping for a day is usually noise or a model update. Three models drifting down over a month is a reputation signal.
Worry about themes
An overall score that looks fine while one theme (pricing, support, reliability, security) collapses. This is the most common way brands get surprised. Break the score down by topic and competitor.
Worry about accuracy
Negative or odd sentiment can come from claims that are simply wrong: an outdated price, a discontinued feature, a competitor's complaint attributed to you. That is a content and fact problem, and it is fixable. Find the claim, find the page the model learned it from, and correct the source.
Worry about comparison
If you are at 50 and your three closest competitors are at 70, you have a gap even though your own trend line is flat. Sentiment is only meaningful against a benchmark.
Do not worry about
- A small move on a small sample.
- A 50 driven by neutral, factual mentions in informational prompts. That is what a well-behaved, descriptive answer looks like.
- A one-day spike after a model or retrieval change. These happen. Promptwatch Data has documented abrupt shifts such as ChatGPT's citation share for Reddit dropping from about 4% to 0.5% on August 14, 2026. When the source mix changes overnight, sentiment about brands that relied on those sources can move without anything changing on your side.
A simple way to read your score
When you open a sentiment dashboard, run through this checklist:
- What is the scale, and what does the midpoint mean in this tool?
- How many mentions are behind the number? Is there a confidence indicator?
- What is the positive/neutral/negative split?
- Which topics are driving it, and which are the weakest?
- How does it compare with named competitors, and with last month?
- Which models are pulling it up or down?
- Can you open the actual response snippets behind the lowest-scoring themes?
If you cannot answer 7, the number is a symptom with the diagnosis deleted.
Tools that report AI sentiment
Most AI visibility platforms include some form of sentiment. The differences are in how transparent the scale is and what you can do after you see a problem.
Promptwatch reports sentiment on a 0-100 scale where roughly 50 is neutral, scored independently of visibility, so a brand can be highly visible and poorly regarded or the reverse. It breaks sentiment down by prompt, topic and competitor with trends, and its Brand Narrative feature pulls out the individual claims AI makes about you (for example "affordable for small teams" or "mobile app lacks features"), groups them into themes like Pricing, Features, Support and Reputation, and scores each theme. Fact Check on higher plans then lets you mark a claim accurate or inaccurate and finds the pages on your site that state it. That is the diagnosis step most dashboards skip.
Other tools in the catalog that publish sentiment or tone data include LLM Pulse, with its five-level scale and net sentiment, and Moz, with its 1-100 score, confidence levels and sentiment drivers.
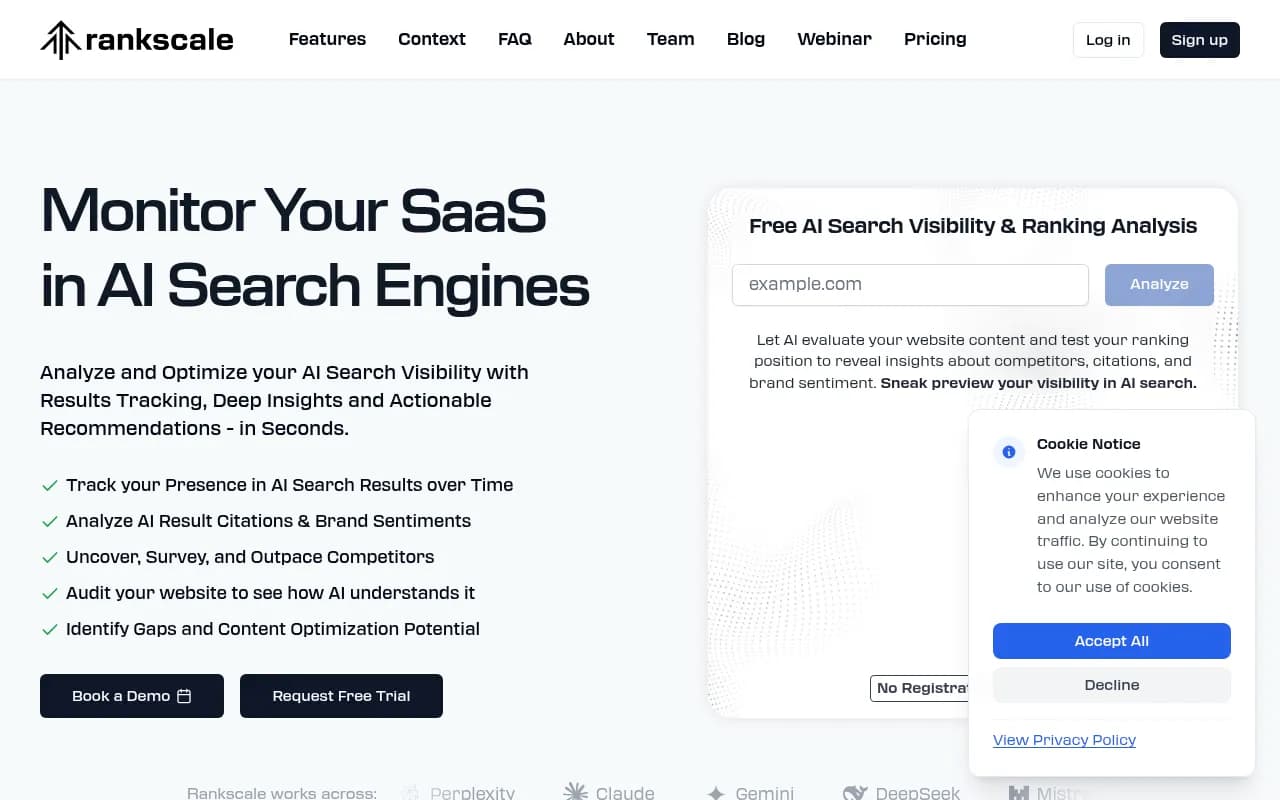
Rankscale is another option with a documented 0-100 formula, which makes it easy to reason about what a given value means.
For a broader view of the category, the GEO software directory at bestgeosoftware.com lists many more options.
| Tool | Scale | Mention breakdown | Theme-level view | Published formula |
|---|---|---|---|---|
| Promptwatch | 0-100, about 50 neutral | Yes, by prompt, topic and competitor | Brand Narrative themes with scores | Documented in its Academy |
| LLM Pulse | -1 to +1 | Yes, full distribution plus net sentiment | Key topics per response | Yes |
| Moz AI Visibility | 1-100 | Yes, Mentions Breakdown | Top Themes and Sentiment Drivers | Formula not published |
| RankScale | 0-100 | Based on classified mentions | Not documented | Yes |
Check each vendor's current documentation before comparing, since scales and features change.
Accuracy: what to ask any vendor
One gap worth being honest about: I could not find independent data on how accurate AI sentiment classification is for brand mentions, or how much a score varies from one run to the next. Until that exists, ask vendors directly:
- How is each mention classified, and by which model?
- Are mixed statements counted as both positive and negative?
- Is there a confidence value, and can I see mention counts?
- How often are prompts run, and how stable is the score if I run the same prompts twice?
- Can I read the underlying response snippets?
A vendor who cannot answer these is asking you to trust a number.
What to do when the score is low
A low score is a to-do list, not a verdict.
- Open the lowest-scoring theme and read the actual snippets.
- Separate accurate criticism (a product or pricing issue) from inaccurate claims (stale or wrong information).
- For inaccurate claims, find the pages the model cites and fix or replace them. Publish clear, current pages on the topic.
- For accurate criticism, the fix is outside marketing, but your messaging can still address it honestly.
- Re-run the same prompts and compare. Keep the prompt set stable so you are measuring change, not a different sample.
If you are weighing whether to handle this in-house, 1001 SEO Media, the agency that publishes this site, works on AI search visibility for brands and can help with the content side of it.
The bottom line
A 50 is a midpoint, not a grade. It could mean a brand that AI describes neutrally, or one it fights over. The number gets useful only when you know the scale, the sample size, the distribution, the themes and the trend. Look at those five things and a 50 stops being mysterious.
Start by finding your tool's documentation for the score, writing down what the midpoint means, and noting how many mentions sit behind this month's figure. Everything else follows from that.