Key takeaways
- Core Web Vitals remain a real ranking factor in 2026, but they work as a tie-breaker — great content on a slow site still beats mediocre content on a fast one
- Slow sites are now being filtered out of AI Overviews and other generative search results, making performance a GEO concern, not just an SEO one
- Google ranks on field data (CrUX) from real Chrome users, not Lighthouse lab scores — a perfect 100 in GTmetrix means nothing if real mobile users experience 8-second loads
- INP has replaced FID as the interactivity metric; the "Good" threshold is 200ms, but competitive sites are targeting sub-150ms
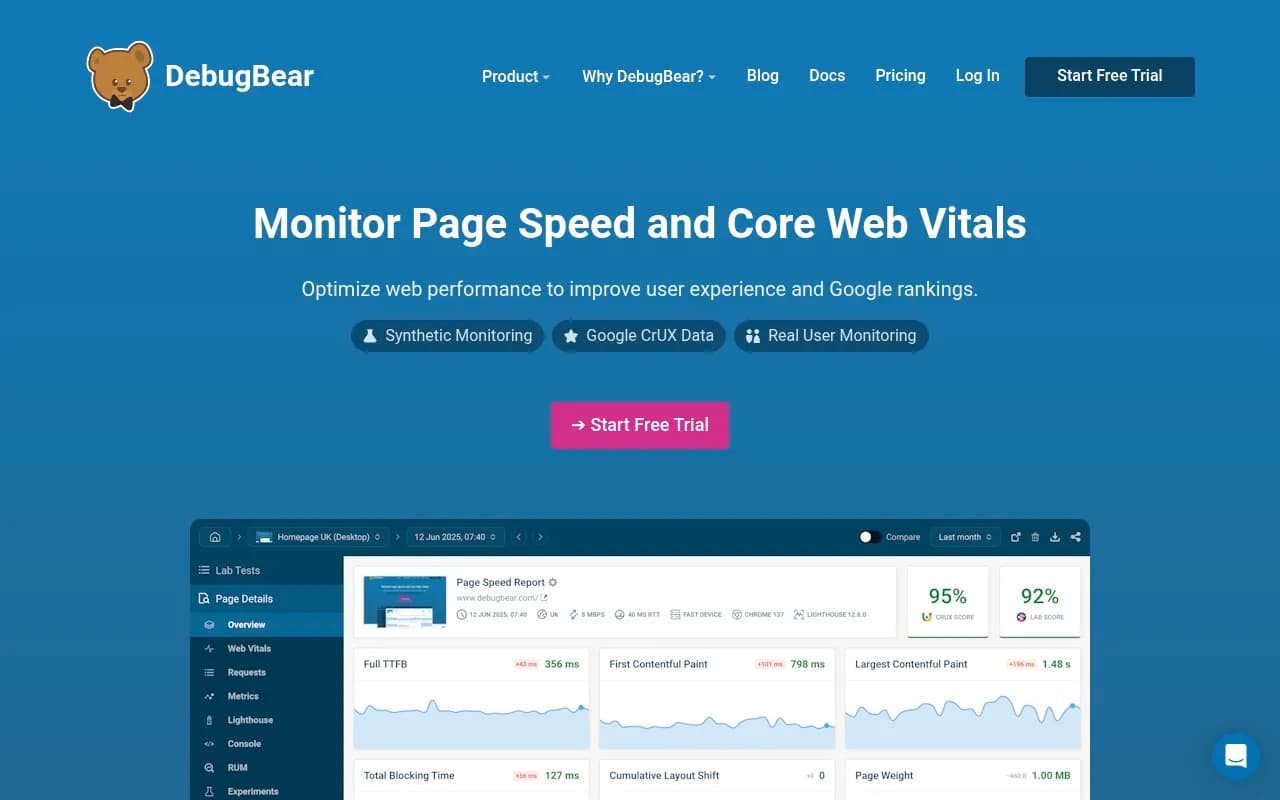
- Tools like GTmetrix, DebugBear, and Google PageSpeed Insights are still genuinely useful — but you need to understand what each one actually measures
Site speed has always been one of those topics that sounds more settled than it actually is. "Fast sites rank better" — sure, broadly true. But the details matter a lot, and in 2026, the details have shifted in ways that make this conversation more interesting than it was two years ago.
The short answer to the title question: yes, performance tools still matter. But the reasons why have expanded, and some of the ways people use these tools are still wrong in ways that lead to wasted effort.
Let me walk through what's actually going on.
What Core Web Vitals measure (and what they don't)
Core Web Vitals are three metrics Google uses to quantify real-world user experience:
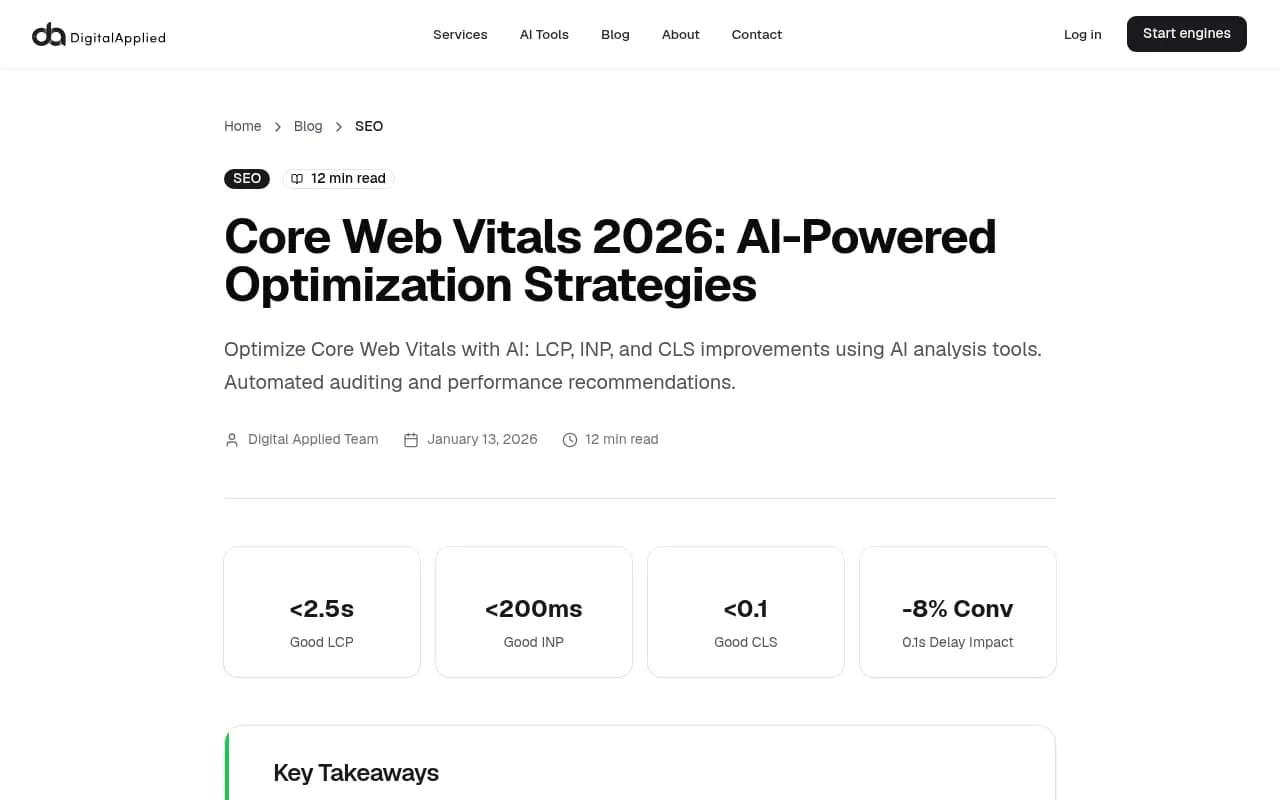
- LCP (Largest Contentful Paint): How long it takes for the main content to load. Good is under 2.5 seconds.
- INP (Interaction to Next Paint): How quickly the page responds to user interactions. Good is under 200ms — though top-performing sites are targeting sub-150ms in 2026.
- CLS (Cumulative Layout Shift): How much the page jumps around as it loads. Good is under 0.1.
One important update: FID (First Input Delay) was deprecated by Google. If your monitoring dashboard still shows FID as a primary metric, update your tooling. INP replaced it because it measures the full interaction lifecycle, not just the first one.
What CWV doesn't measure: content quality, topical authority, backlinks, or whether your page actually answers the user's question. This is why the "tie-breaker" framing matters. Two pages with equivalent content? The faster one wins. But CWV can't compensate for thin content or a weak answer.
The 2026 shift: AI Overviews are filtering slow sites
This is the part that changes the calculus for a lot of teams.
Google's AI Overviews (and similar generative features in Perplexity, ChatGPT, and others) don't just pull from the highest-ranking pages. They apply their own filters, and site experience is one of them. A slow site — even with excellent content — can get excluded from AI-generated summaries entirely.
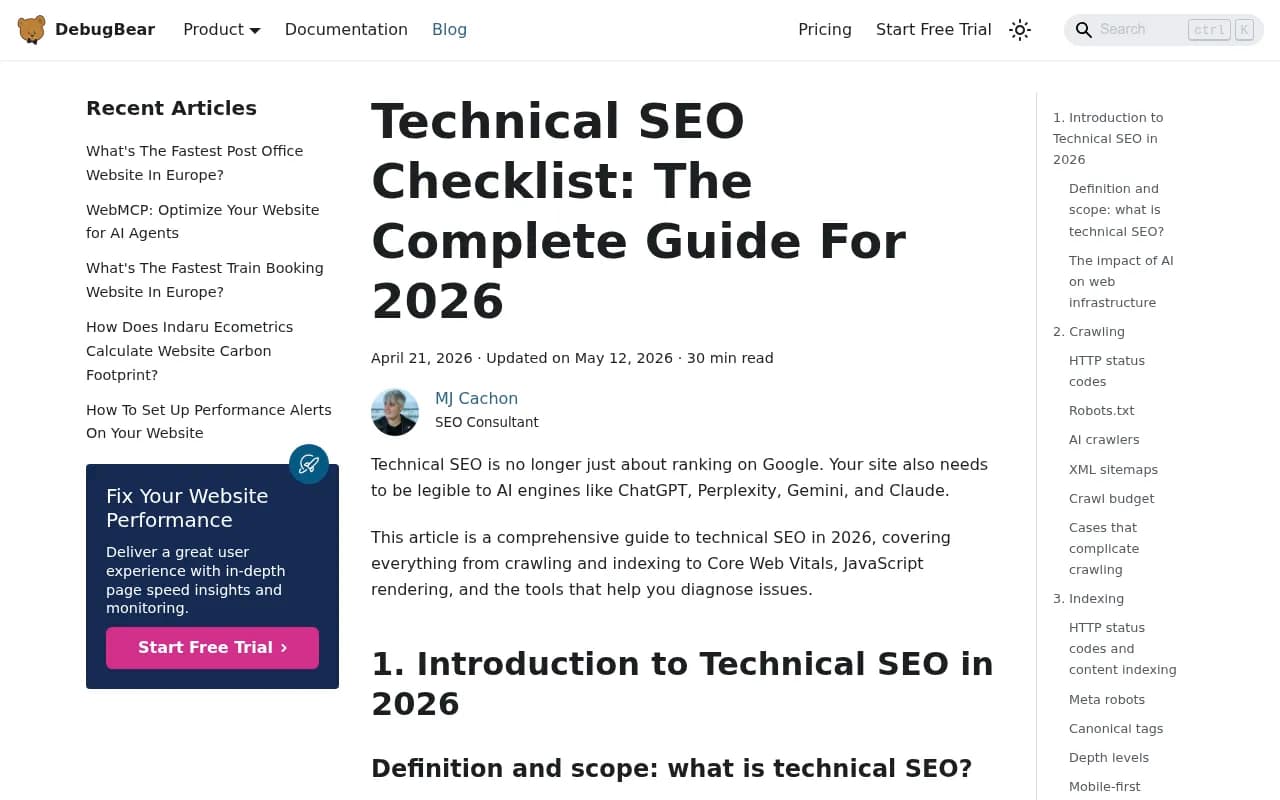
DebugBear's 2026 technical SEO guide makes this explicit: technical SEO is no longer just about ranking on Google. Your site needs to be legible to AI engines like ChatGPT, Perplexity, Gemini, and Claude. That includes performance, but also JavaScript rendering, semantic HTML structure, and crawlability.
This creates a new pressure point. Previously, a slow site might drop a few ranking positions. Now, it might get excluded from the AI summary that appears above all the organic results — which is where an increasing share of clicks and attention is going.
If you're tracking your brand's visibility in AI search engines, tools like Promptwatch can show you whether your pages are actually being cited in AI responses, and which technical issues might be blocking that.
Field data vs. lab data: the most common mistake
Here's where a lot of teams go wrong with performance tools.
Lighthouse (which powers GTmetrix, PageSpeed Insights, and most other tools) runs in a controlled lab environment. It simulates a specific device, network speed, and cache state. The score you get is useful for diagnosing issues — but it's not what Google uses for ranking.
Google uses CrUX: the Chrome User Experience Report. This is field data from real Chrome users visiting your actual site, on their actual devices, on their actual connections. If your users are primarily on mobile in emerging markets with 3G connections, your CrUX data will look very different from your Lighthouse score.
A Reddit thread on pagespeed testing tools put it well: "Lighthouse and GTmetrix are good, but the scores can still vary because they test under different conditions, server regions, cache states..." The implication is that you need both — lab data to find and fix issues, field data to understand what Google actually sees.
The practical takeaway: don't optimize for a Lighthouse score. Optimize for real user experience, and use Lighthouse to find the specific issues causing problems in the field.
Which performance tools are actually worth using in 2026
There are a lot of tools in this space. Here's an honest breakdown of what each one is good for.
Google PageSpeed Insights
Free, authoritative, and the closest you'll get to seeing what Google sees. It shows both lab data (Lighthouse) and field data (CrUX) in one place. The field data section is the one that matters for rankings. If your page doesn't have enough CrUX data (low traffic), it won't show field data — which is a limitation for smaller sites.
GTmetrix
GTmetrix runs Lighthouse under the hood but adds its own waterfall charts, historical tracking, and the ability to test from different server locations. It's particularly good for diagnosing what's causing slow loads — you can see exactly which resources are blocking render, in what order, and how long each one takes.
The free tier is useful for spot-checking. The paid plans add scheduled monitoring and alerts, which matters if you want to catch regressions before they affect rankings.

DebugBear
DebugBear is built specifically for continuous performance monitoring. Where GTmetrix is great for one-off audits, DebugBear is designed to run tests on a schedule and alert you when something changes. It tracks Core Web Vitals over time, which is valuable for understanding whether a deployment improved or hurt performance.
It also integrates with CI/CD pipelines, so teams can catch performance regressions before they ship to production. For engineering teams that care about performance as part of their development workflow, this is the most relevant tool.
Google Search Console
Often overlooked as a performance tool, but it's the only place where you can see your actual CrUX data segmented by URL group. The "Core Web Vitals" report shows which pages are failing, needs improvement, or passing — based on real user data. This is your ground truth for what Google is actually measuring.
Screaming Frog SEO Spider
Not a speed tool per se, but relevant here because it can crawl your site and identify pages with performance-related issues at scale — things like render-blocking resources, missing preload hints, or JavaScript-heavy pages that might be slow to load. Useful for large sites where you can't manually check every URL.

Tool comparison: what each one is best for
| Tool | Data type | Best for | Free tier | Continuous monitoring |
|---|---|---|---|---|
| Google PageSpeed Insights | Lab + Field (CrUX) | Checking what Google sees | Yes | No |
| GTmetrix | Lab (Lighthouse) | Diagnosing specific load issues | Yes (limited) | Paid |
| DebugBear | Lab + alerts | CI/CD integration, regression tracking | Trial | Yes |
| Google Search Console | Field (CrUX) | Real user data by URL group | Yes | Yes (delayed) |
| Screaming Frog | Crawl analysis | Site-wide technical audits | Yes (500 URLs) | No |
What actually moves the needle on Core Web Vitals
Knowing your scores is one thing. Fixing them is another. Here are the highest-impact changes, roughly in order of how often they're the root cause:
For LCP (loading):
- Serve images in modern formats (WebP, AVIF) and size them correctly for the viewport
- Use a CDN to reduce time to first byte
- Preload the LCP image element so the browser fetches it early
- Eliminate render-blocking CSS and JavaScript above the fold
For INP (interactivity):
- Break up long JavaScript tasks using
scheduler.yield()or React'suseTransition - Defer non-critical third-party scripts (analytics, chat widgets, ad tags)
- Avoid heavy event listeners that block the main thread
For CLS (visual stability):
- Always specify width and height attributes on images and video elements
- Reserve space for ads and embeds before they load
- Avoid inserting content above existing content after the page loads
Mobile-first matters here too. Google primarily ranks based on mobile CWV scores. If you're only testing on desktop, you're optimizing for the wrong thing.
The AI crawler angle: performance affects more than rankings
There's a dimension to site performance that most teams aren't thinking about yet: how it affects AI crawlers.
AI engines like ChatGPT (via GPTBot), Perplexity, and Claude's crawlers visit your pages to gather content for their responses. If your pages are slow to render, JavaScript-heavy, or return errors when crawled, these bots may not get the full content — or may deprioritize your pages in favor of faster, more accessible sources.
DebugBear's technical SEO guide notes that for AI legibility, you need to ensure HTML isn't dependent on JavaScript, optimize semantic content, and use structured data that provides context. A page that scores 95 on Lighthouse but renders its main content via client-side JavaScript is effectively invisible to crawlers that don't execute JavaScript.
This is where performance and technical SEO overlap with GEO (Generative Engine Optimization). A fast, well-structured, crawlable page is more likely to be cited in AI responses than a slow, JavaScript-dependent one — regardless of how good the content is.
Tools like Screaming Frog can help you identify JavaScript rendering issues at scale.
The revenue argument for performance
One number worth keeping in mind: a 0.1 second delay in page load causes an 8% drop in conversions. That's not a theoretical SEO benefit — it's a direct revenue impact.
This reframes the conversation with stakeholders who don't care about ranking factors. Performance isn't just an SEO project; it's a conversion rate optimization project. The business case is straightforward: faster pages convert better, rank better, and are more likely to appear in AI-generated answers.
How to prioritize your performance work
Given everything above, here's a practical prioritization framework:
- Check your CrUX data in Google Search Console first. Which pages are failing? Start there, not with your Lighthouse score.
- Run GTmetrix or PageSpeed Insights on the failing pages to identify the specific issues.
- Fix LCP issues first — they tend to have the biggest impact on both rankings and user experience.
- Check your pages for JavaScript rendering issues using Screaming Frog or a similar crawler. If your content isn't in the HTML source, AI crawlers can't read it.
- Set up continuous monitoring with DebugBear or a similar tool so you catch regressions before they affect your CrUX data.
- If you're investing in content for AI search visibility, use a platform that tracks whether your pages are actually being cited — not just whether they rank.
Do performance tools still matter?
Yes — but the context has expanded. In 2026, a slow site doesn't just lose ranking positions; it risks being excluded from AI Overviews entirely, and it's less likely to be cited by AI crawlers that index the web for generative responses.
GTmetrix and DebugBear are still the right tools for diagnosing and monitoring performance. Google Search Console is still the right place to see what Google actually measures. The difference is that performance now sits at the intersection of traditional SEO, conversion optimization, and AI search visibility — which means it deserves more attention, not less.
The floor for competitive performance has risen. Sub-150ms INP, LCP under 2.5 seconds on mobile, and clean HTML that doesn't depend on JavaScript rendering — these aren't nice-to-haves anymore. They're table stakes for appearing in the places where your audience is increasingly finding answers.