Key takeaways
- AI answers have no fixed rank. What you can measure is whether you are named, how early, and how often compared with competitors.
- Visibility score averages across every answer, including the ones that never mention you, so small numbers are normal. Read the trend, not the absolute figure.
- Share of voice is a ratio, so adding competitors or changing prompts moves it even when your performance did not change.
- Almost half of ChatGPT responses cite 10 or more domains, so "position" is about sharing a crowded answer, not winning a list.
- Any single check is close to meaningless. Measure across many prompts, over time, with a locked method.
Why "rank" is the wrong word
In Google, rank is simple. There is a list of ten links, and you are number three or number eleven. Everyone agrees on the definition, and the number is the same for everyone who searches that exact query from the same place.
AI search does not work like that. An answer is generated, not retrieved from a fixed list. Ask the same question twice and the brand list can change. In a SparkToro and Gumshoe study reported by Search Engine Land in January 2026, about 600 volunteers ran 12 identical prompts nearly 3,000 times. ChatGPT, Claude and Google's AI returned the same list of brands less than once in 100 runs.
So when a vendor says "you rank #4 in ChatGPT", ask what that means. It might be an average position across 200 runs. It might be one screenshot. Those are very different claims.
Three metrics get used as stand-ins for rank, and they answer three different questions:
| Metric | Question it answers | Typical calculation | Main trap |
|---|---|---|---|
| Position | Where in the answer am I named? | Order of first mention, averaged across runs | Order may reflect style, not quality |
| Visibility score | How present am I overall? | Average per-answer score, zero when unnamed | Branded prompts inflate it |
| Share of voice | How much of the attention do I hold against rivals? | Answers naming you divided by answers naming any tracked brand | Depends on who you track |
Keep those three separate in your head and most confusion in AI visibility reporting goes away.
Position: where you appear inside one answer
Position is the closest thing to a classic rank. If an answer recommends five project management tools and yours is named second, your position is 2 for that response.
Two problems make this shakier than it looks.
First, slot counts differ by engine. Promptwatch's average sources per response report (dated September 2025, so treat the exact figures as possibly dated) found ChatGPT citing about 5 sources per web-search answer, Google AI Overviews about 10, and Perplexity almost exactly 10 every day. Copilot swung from under 2 to nearly 17 within a few weeks. Position 3 in a five-slot answer and position 3 in a ten-slot answer are not the same thing.
Second, answers are crowded. Promptwatch's report on unique domains per ChatGPT response (Sep 28 to Oct 4, 2026) found that 47.6% of responses cite 10 or more different domains and 66.1% cite at least 8. Only 1% cite a single domain. For organic prompts where no brand is named, 52.5% cite 10 or more. You will almost never have an answer to yourself.
The practical advice from that same report is worth following: expect to share every answer, track where you appear and how ChatGPT describes you rather than only whether you are cited, and check which competitors show up in the same responses as you.
Mention position versus citation position
There are two different things people call position.
- Mention position is where your brand name appears in the answer text.
- Citation position is where your domain lands in the source list.
You can be named first and never linked. You can be linked in the sources and never named. Good reporting keeps these apart. If your brand is mentioned but your own pages are never cited, that points to a content or crawlability problem. If your pages are cited but your brand is not named, that is more of a prominence problem.
Visibility score: an average, not a rank
A visibility score is the number most dashboards put at the top. Vendors define it differently, but the common logic is the same. Each answer gets a score based on whether you are named and how prominently. Then those scores are averaged.
Surfer describes it as combining how often an entity is mentioned with its average position or prominence. OptimizeGEO's methodology is more explicit: it scores each answer, then divides by all answers collected, not just the ones that mention you. Answers that do not name you count as zero.
That zero-counting is why scores in competitive categories are often single digits. A 6% visibility score does not mean you are failing. It can mean you are named in a modest share of answers in a category with 20 strong players. A low number can still represent real progress, so always read the trend.
What is a good score?
There is no universal benchmark. Surfer makes the useful point that appearing in 30% of relevant answers sounds unimpressive until you learn your closest competitors appear in 10%. Context beats the raw figure.
One vendor, BrandViz.AI, suggests top brands in established SaaS categories can reach a 40 to 60% share of AI voice or higher. That is a vendor claim for one definition in one category, so use it as a loose reference at best. The honest answer is to benchmark against your own previous period and your named competitors, on the same prompts.
Branded prompts will flatter you
If your prompt set includes "What is [your brand]?" you will score well on it, obviously. Mixing those with unbranded buyer questions like "best CRM for a ten-person agency" produces a number that looks healthy and means little. Report branded and non-branded prompts separately. The same goes for countries and languages.
Share of voice: a ratio, and the denominator is your choice
Share of voice comes from advertising, where it meant your share of category ad spend. In AI search it is counted from answers you collect, which makes the prompt set and competitor list part of the definition.
The common formula: answers naming your brand divided by answers naming any tracked brand, across the same prompts, engines and period.
But Omnibound's worksheet shows how loose this is. From the same 20 invented answers, you can get four different numbers:
| Reading | What it counts | Result in the example |
|---|---|---|
| Appearance share | Your mentions out of all brand mentions | 25% |
| Answer presence | Answers naming you out of all answers | 45% |
| Tracked citation share | Your cited sources out of all cited sources | 28% |
| First-named share | Answers where you are named first | 16% |
None of these is a standard. Each is a reasonable thing to call share of voice, which is why a definition belongs under every chart. Answer presence is technically a rate, not a share, and it does not change when you add competitors. That makes it a useful companion number.
Why share of voice can fall while you improve
This one catches people out. Share of voice is a ratio. If the category grows faster than you do, or you add competitors to the tracked list, your share falls even when more answers name you. That is a denominator change, not a performance drop.
OptimizeGEO's own category tracking shows how this can happen: brand mentions per run grew 32% in India and 28% in the USA in five weeks (4 Aug to 9 Sep 2026). That growth alone pushes every brand's share down.
The fix is boring and effective. Lock your competitor list and prompt set for each reporting period, and log every change with a date.
A quick test of your own numbers
Omnibound suggests a check I like. Take last month's report and calculate your appearance share twice: once with your usual rival list, and once without the rival named most often. If the two numbers tell different stories, report answer presence and both shares, say which list you used, and note the date of any change. It shows how much of your share of voice is your presence and how much is your choice of competitors.
Sample size: how far a number moves by chance
Each AI answer is one draw. A small number of draws leaves a wide range. In Omnibound's example, a brand named in 9 of 20 answers (45%) has a 95% range of roughly 26 to 66%. A rival named in 14 of 20 (70%) ranges from about 48 to 86%. Rival A looks well ahead, but the ranges overlap, so 20 answers cannot tell you whether it really leads.
Their rule of thumb: fewer than 30 answers is a warning sign, and telling 20% from 30% reliably takes about 385 per period. Most teams will have wide ranges and should say so.
This is why Promptwatch's guidance is to measure across many prompts, because a single prompt tells you little.
Why Google rank and AI visibility diverge
If you assume AI answers just reuse the Google top 10, the numbers will surprise you. Surfer's write-up cites figures that only 12% of URLs cited by ChatGPT, Perplexity and Copilot rank in Google's top 10, and that 80% of LLM citations do not rank in Google's top 100. Those come from a third-party roundup, so treat them as directional.
Promptwatch's data points the same way on authority. In August 2026, sites with domain rank 46 to 75 earned almost half of ChatGPT citations, while DR 91 to 100 fell to about 3% (ChatGPT citation share by domain rank). Big domains do not automatically win.
There is also the query fanout effect. ChatGPT does not search your literal prompt; it generates its own web queries. Promptwatch's query fanout data shows averages of 2.15 fanouts per response in December 2025 and about 1.84 by early March 2026, with query length falling from roughly 117 characters to the high 80s. On August 8, 2026, ChatGPT began using the site: operator at scale, jumping from about 0.4% to about 17% of fanout queries (report). Your content has to match one of those generated queries, so headings that read like search queries help.
Finally, the engines change underneath you. Average citations per ChatGPT response dropped around the GPT-5.3 rollout on March 4, 2026 (report). A visibility dip right then may be an engine change, not your content.
A reporting setup that holds up
Here is a method I would actually use.
- Fix a prompt set of at least 100 buyer questions, split into branded, unbranded and competitor comparison.
- Lock a competitor list for each period. Record any change with a date.
- Track by engine and country separately. A blended number hides the story.
- Report four numbers together: answer presence, visibility score, share of voice and average position, with the definition printed beside each.
- Read them as a diagnosis. Low share of voice is a coverage problem. Late position is a prominence problem. Mentions without self-citations are a content or crawlability problem. Weak sentiment is a reputation problem.
- Review monthly, not daily. Copilot-style swings make weekly snapshots misleading.
- Re-baseline whenever the prompt set, competitor list or engine mix changes.
Tools that report these metrics
The same brand can score very differently under different formulas, so compare tools on method, prompt volume and engines, not headline scores.
Promptwatch reports a Visibility Score (0 to 100), Share of Voice, position in the answer, sentiment and citation rank, and tracks the real interfaces of ChatGPT, Google AI Overviews, AI Mode, Gemini, Perplexity and others. It also logs AI crawler visits and ties AI traffic back to your pages, which helps when you need to explain why a metric moved.
Plenty of other tools report similar numbers with different formulas.
Profound
Otterly.AI

| Tool | Type | Best for |
|---|---|---|
| Promptwatch | Tracking plus content and crawler data | Teams that want to act on the numbers |
| Profound | Enterprise monitoring | Large brands tracking many engines |
| Otterly.AI | Prompt tracker | Simple mention tracking |
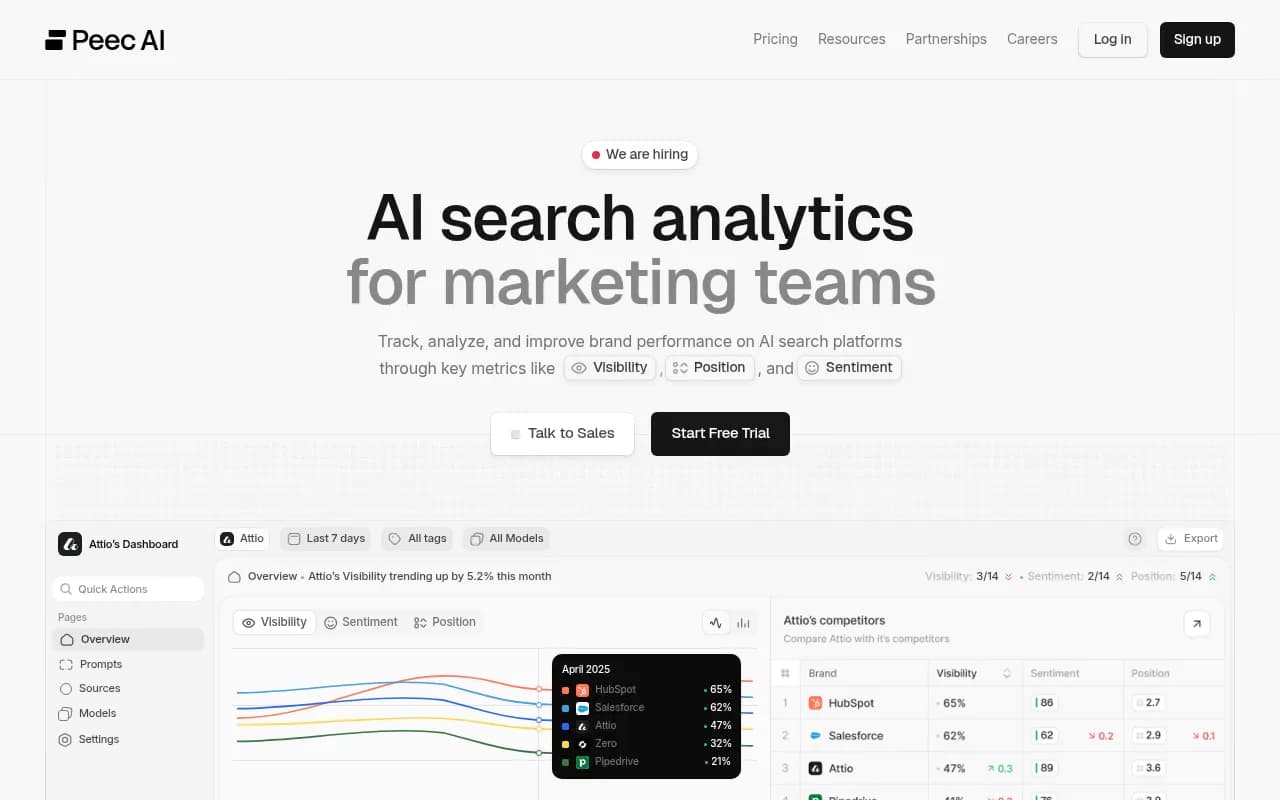
| Peec AI | Prompt tracker | Marketing teams starting out |
| Semrush AI Toolkit | SEO suite add-on | Teams already in Semrush |
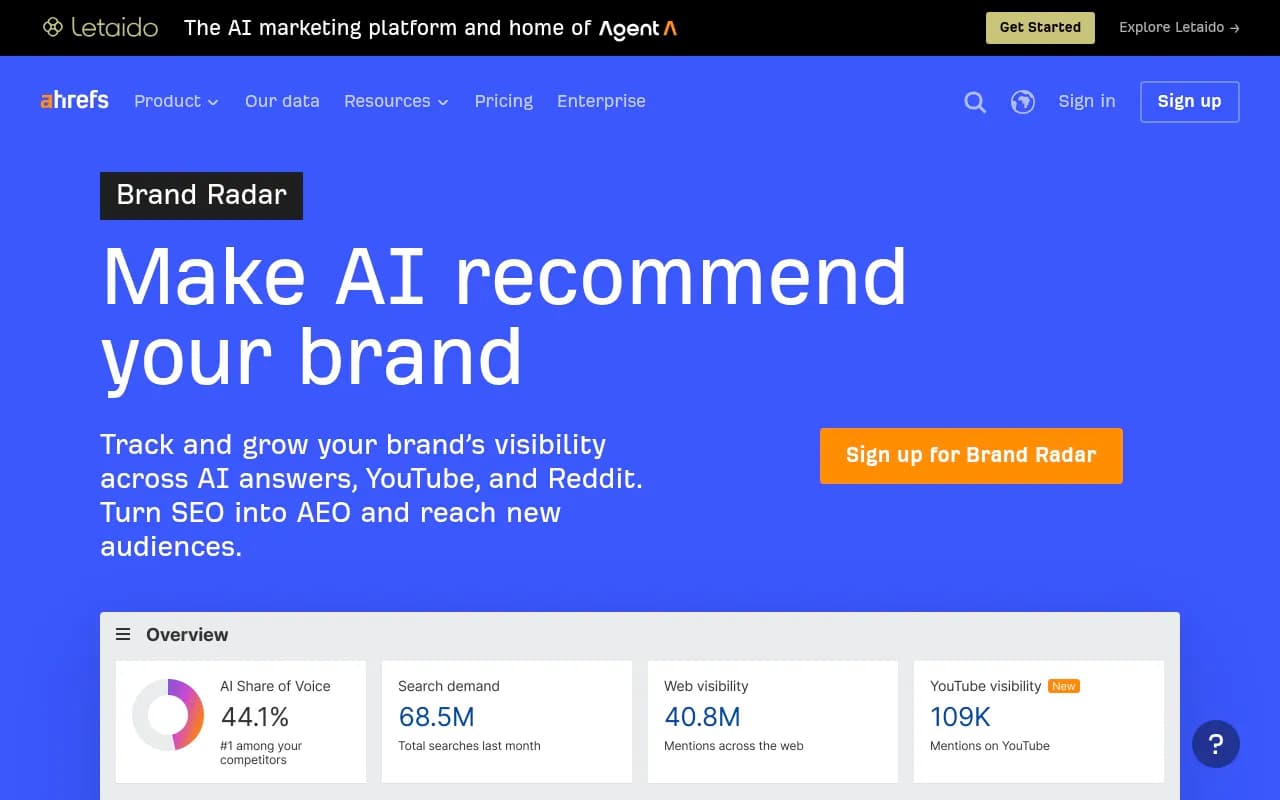
| Ahrefs Brand Radar | SEO suite add-on | Teams already in Ahrefs |
For a wider list, the GEO software directory and the AI rank tracking tools directory cover more options.
FAQ
How is an AI visibility score different from a Google ranking?
A Google ranking is a position in a list of links. An AI visibility score is an average across many AI answers, so it reflects how often you are named, not where you rank.
Is a mention the same as a citation?
No. A mention means you were named. A citation means a source link pointed to your content. They can move in opposite directions.
When should I reset my baseline?
Whenever the prompt set, competitor list or engine mix changes. Otherwise month-on-month comparisons are not valid.
Can I trust a single check?
No. Given how rarely repeat runs return the same brand list, one screenshot proves very little.
The short version
AI search has no rank, only measurements that approximate one. Position tells you where you land in a crowded answer, visibility score tells you how present you are on average, and share of voice tells you how you compare with the rivals you chose. Pick definitions, print them next to every chart, lock your inputs each period, and judge by the trend across a large prompt sample.