Key takeaways
- ChatGPT visibility is now a real marketing metric -- 60% of organic traffic flows directly from AI responses, so tracking citations matters more than tracking keyword ranks
- A useful visibility dashboard tracks brand mentions, citation share, sentiment, competitor benchmarks, and AI traffic attribution in one place
- Most monitoring tools show you data but stop there; the ones worth using also help you act on gaps
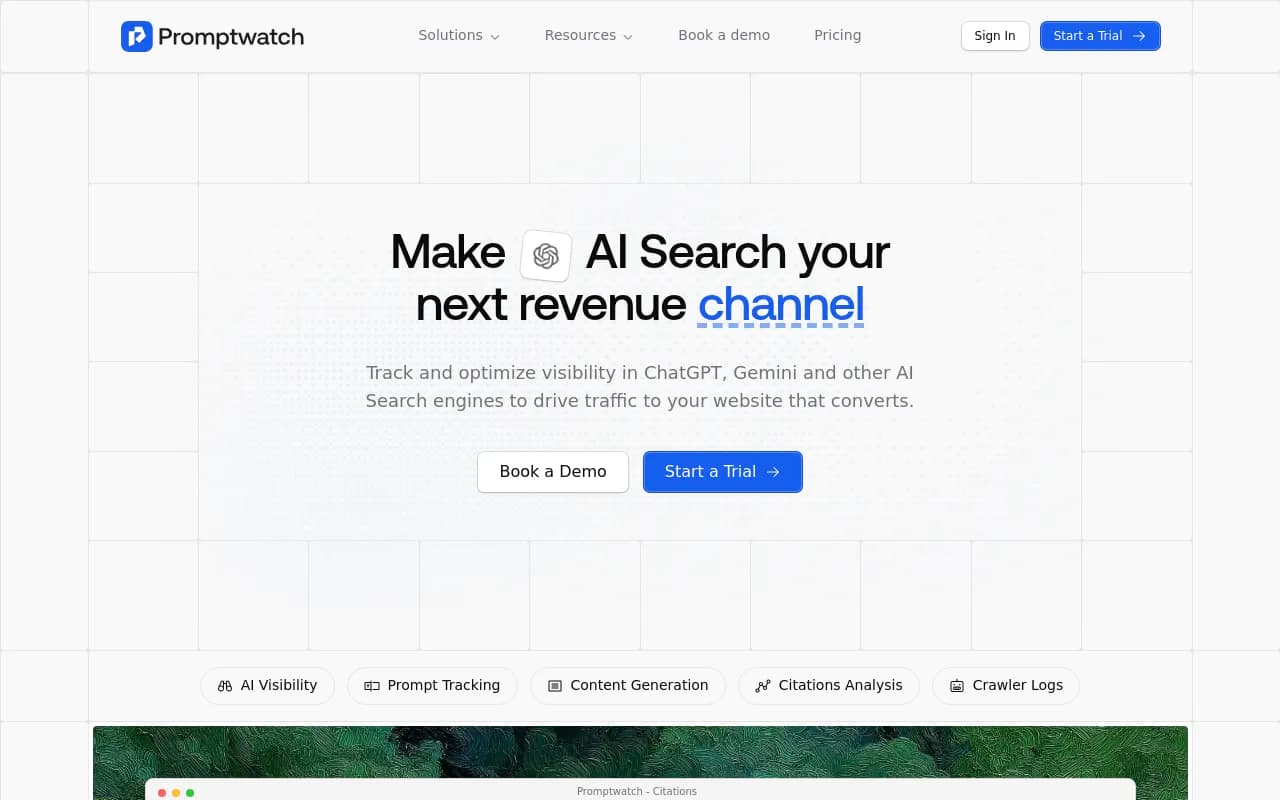
- You don't need to build this from scratch -- purpose-built AI visibility platforms handle the heavy lifting, with Promptwatch being the most complete option for teams that want to go beyond monitoring
- The dashboard only has value if it connects visibility to business outcomes -- set up traffic attribution from day one
Why your marketing team needs a ChatGPT visibility dashboard
A year ago, "ChatGPT visibility" was a niche concern for early-adopter SEOs. Now it's a board-level conversation. According to a Forbes analysis, 60% of organic traffic is flowing directly from AI-generated responses -- meaning a significant chunk of your potential audience never sees a search results page at all. They ask ChatGPT, get an answer, and either act on it or don't.
The uncomfortable part: most marketing teams have no idea whether their brand shows up in those answers. They're optimizing for Google rankings while their AI visibility is a black box.
That's the problem a ChatGPT visibility dashboard solves. It gives your team a single view of how your brand appears (or doesn't) across AI search engines, which competitors are winning the conversations you should be in, and what to do about it.
This guide walks through how to build one -- what to measure, which tools to use, how to structure the dashboard, and how to make sure it actually influences decisions rather than collecting dust.
What to measure: the core metrics
Before picking tools, you need to decide what goes on the dashboard. Not every AI visibility metric is equally useful for a marketing team. Here's what actually matters.
Brand mention rate
How often does ChatGPT (or Perplexity, Gemini, Claude, etc.) mention your brand when users ask relevant questions? This is the foundational metric. You define a set of prompts that your target customers are likely to ask -- "best CRM for small businesses," "how to improve email deliverability," whatever fits your category -- and track how frequently your brand appears in the responses.
The percentage of prompts where you appear is your mention rate. A 20% mention rate means you show up in 1 in 5 relevant conversations. That number should go up over time.
Citation share vs. competitors
It's not enough to know your own mention rate in isolation. You need to know it relative to competitors. If you appear in 20% of relevant prompts but your main competitor appears in 60%, you have a problem. Competitor benchmarking turns a vanity metric into an actionable gap analysis.
Sentiment and framing
When AI models do mention your brand, what do they say? Are you described as a market leader, a budget option, a niche tool? Sentiment tracking catches cases where you're being mentioned but framed in ways that don't help conversion. This matters more for brand-heavy categories like SaaS, financial services, and consumer goods.
Source citations
When ChatGPT cites sources alongside its answers, which pages on your site get cited? Which domains -- yours, competitors', third-party review sites -- are being pulled into AI responses? This tells you where to invest content effort and which external placements (like G2, Reddit, or industry publications) are actually influencing AI recommendations.
AI-driven traffic
The metric that closes the loop: how much traffic is actually arriving from AI search engines? This requires either a tracking snippet, Google Search Console integration, or server log analysis. Without it, you're measuring visibility without connecting it to business outcomes.
Choosing the right tools
The AI visibility tool market has exploded. There are now dozens of options, ranging from basic brand mention trackers to full-stack optimization platforms. Here's how they break down.
Monitoring-only tools
These tools track where your brand appears across AI engines and report back. They're useful for getting started but limited if you want to actually improve your visibility.
Otterly.AI is a popular entry point -- it covers brand visibility across ChatGPT, Perplexity, and Google AI Overviews, and starts at $29/month. Good for agencies managing multiple brands on a budget.
Otterly.AI

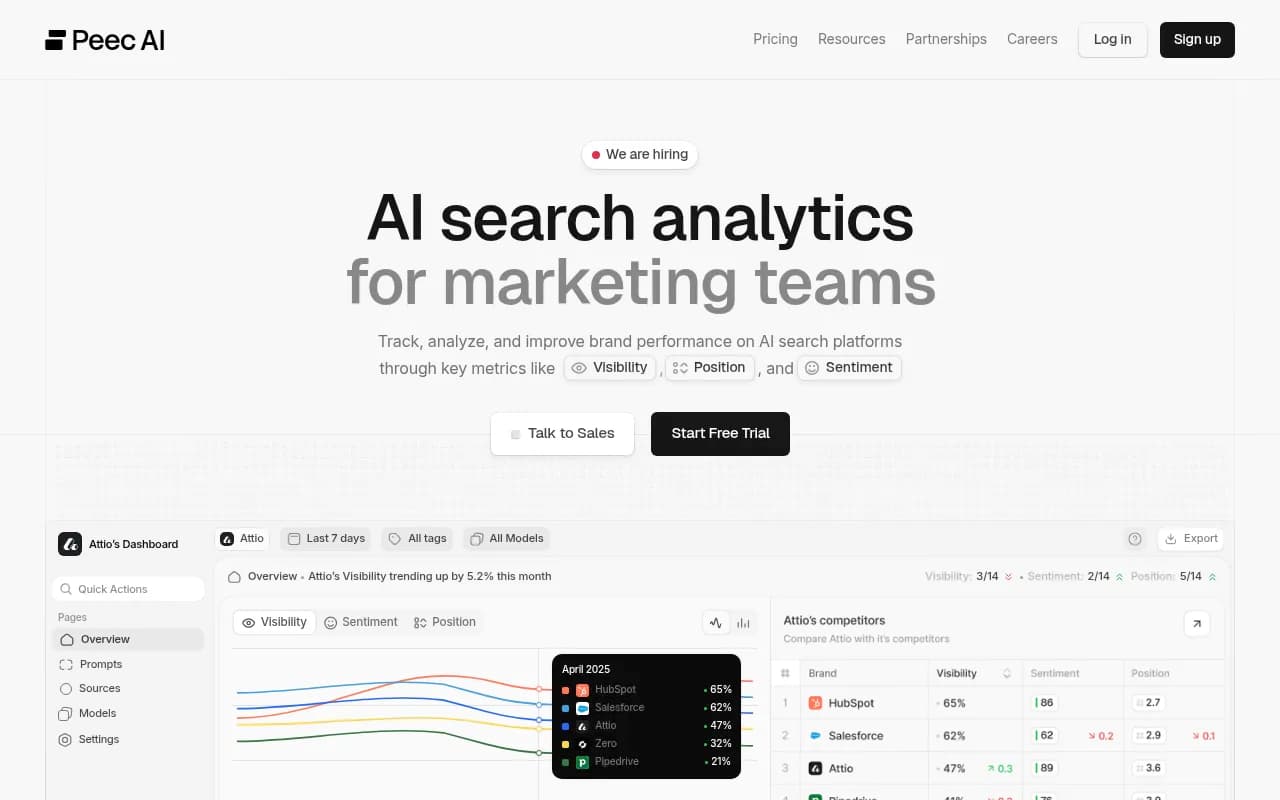
Peec AI tracks brand visibility across ChatGPT, Perplexity, and Claude with a clean interface. Solid for teams that just want to know where they stand.
LLM Pulse monitors brand mentions across major AI search engines and surfaces trends over time.
Nightwatch is worth mentioning for teams that still care about traditional SEO alongside AI -- it combines generative rankings with classic rank tracking, though the AI features are a paid add-on.
Full-stack optimization platforms
These go beyond monitoring. They help you identify what's missing, generate content to fill gaps, and track whether that content improves your visibility.
Promptwatch is the most complete option here. It covers 10 AI models (ChatGPT, Perplexity, Claude, Gemini, Grok, DeepSeek, Copilot, Meta AI, Google AI Overviews, and Google AI Mode), and the core value is the action loop: find gaps with Answer Gap Analysis, generate content with the built-in AI writing agent, then track whether visibility improves. It also includes AI crawler logs -- real-time data on which pages ChatGPT and other AI bots are actually reading on your site -- which most competitors don't have at all.
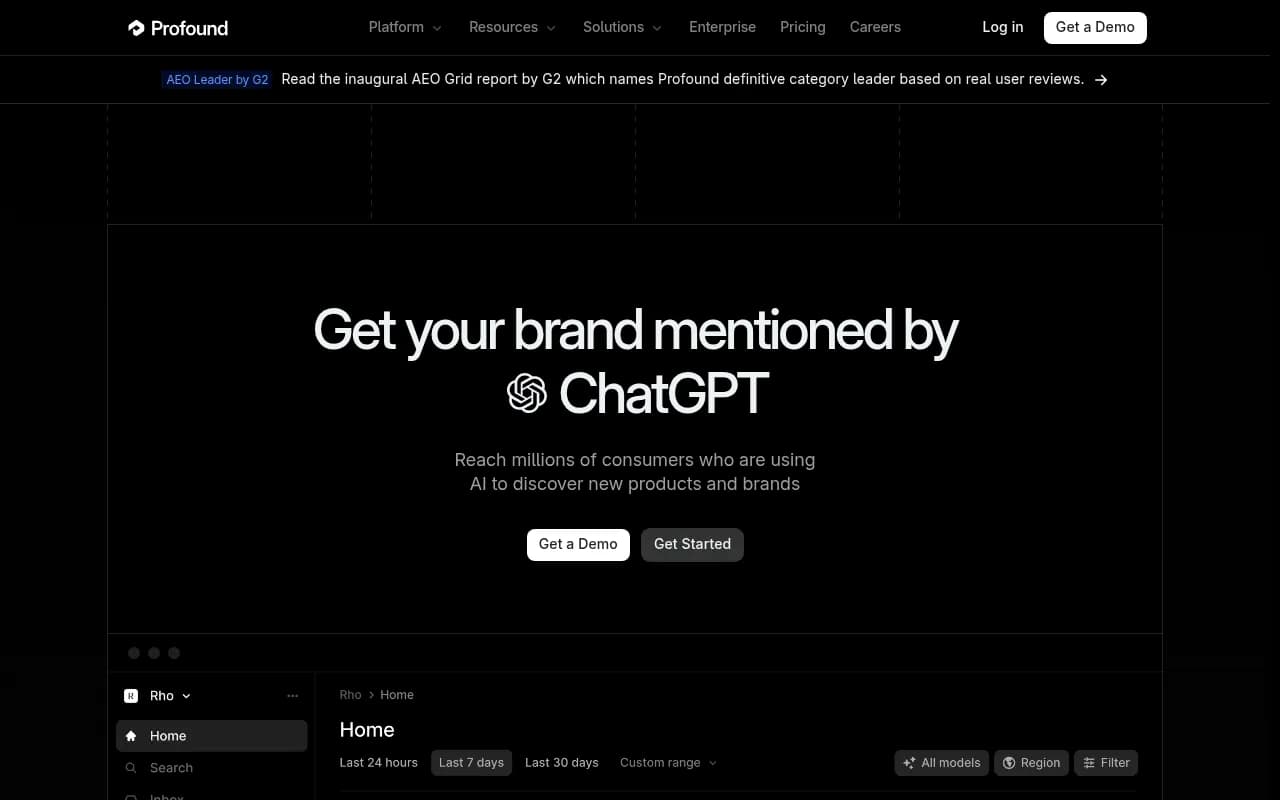
Profound is a strong enterprise option with deep narrative tracking and conversation volume data. Higher price point, but worth it for large brands where AI perception directly affects revenue.
Profound
Rankshift tracks brand visibility across ChatGPT, Perplexity, and other AI search engines with a focus on actionable insights.

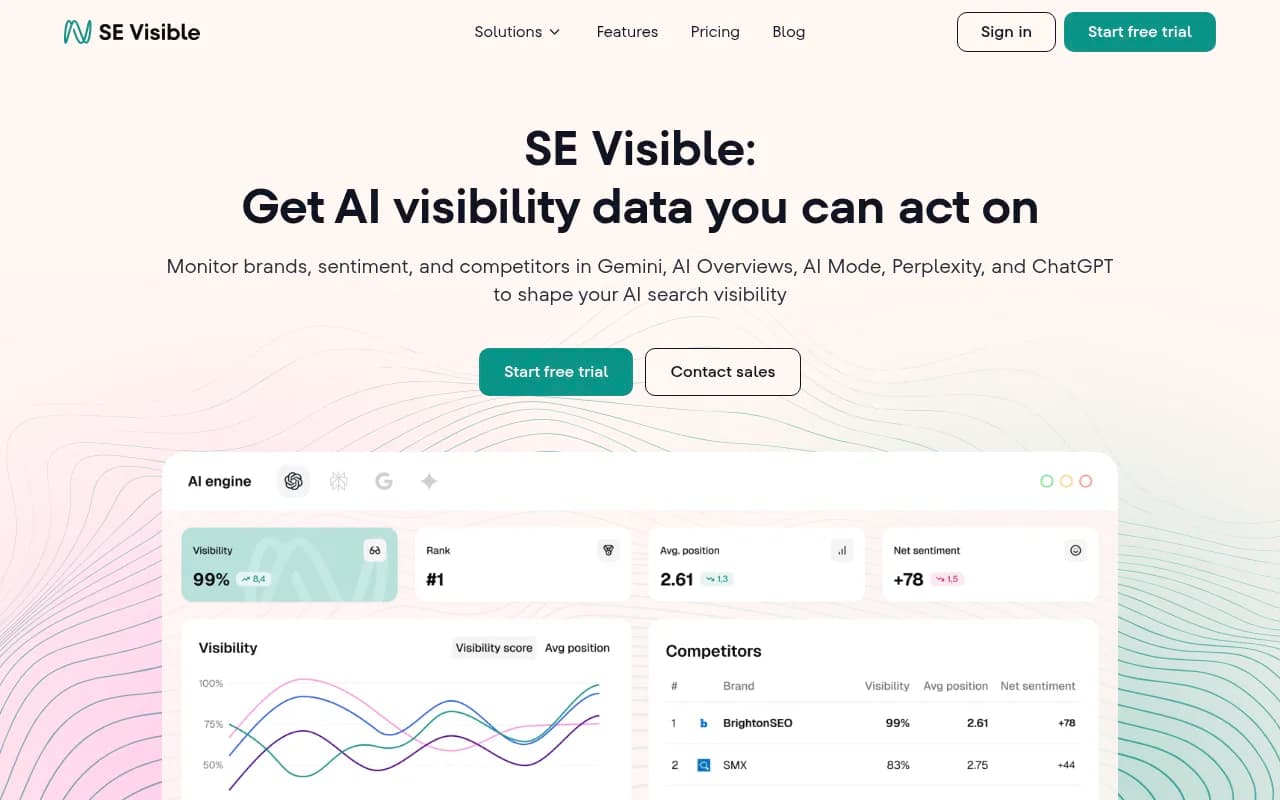
SE Visible (from SE Ranking) offers visibility scores, sentiment trends, and competitor benchmarks. Good for teams already in the SE Ranking ecosystem.
Quick comparison
| Tool | Models covered | Content generation | Crawler logs | AI traffic attribution | Starting price |
|---|---|---|---|---|---|
| Promptwatch | 10 (ChatGPT, Perplexity, Claude, Gemini, Grok, DeepSeek, Copilot, Meta AI, GAI, GAI Mode) | Yes (built-in AI writer) | Yes | Yes (snippet, GSC, logs) | $99/mo |
| Profound | 9+ | No | No | Limited | $99/mo |
| Otterly.AI | 3 (ChatGPT, Perplexity, GAI Overviews) | No | No | No | $29/mo |
| Peec AI | 3 (ChatGPT, Perplexity, Claude) | No | No | No | Custom |
| SE Visible | 4+ | No | No | No | $189/mo |
| Nightwatch | 2+ (AI add-on) | No | No | No | $39/mo + $99 AI |
| Rankshift | 3+ | No | No | No | Custom |
Structuring the dashboard
A good visibility dashboard has four layers. Each layer answers a different question for a different audience.
Layer 1: Executive summary (weekly)
One number your CMO can look at in 30 seconds. Your overall AI visibility score -- the percentage of tracked prompts where your brand appears -- compared to last week and compared to your top competitor. Add a trend line and you're done.
This layer doesn't need to be fancy. A simple card in Google Data Studio or a Slack digest works fine.
Layer 2: Competitive benchmarks (weekly)
A heatmap or bar chart showing your mention rate vs. competitors across your key prompt categories. If you sell project management software, you might track prompts like "best project management tool for remote teams," "Asana alternatives," "how to manage sprint planning," etc. Seeing which competitors dominate which categories tells your content team exactly where to focus.
Tools like Promptwatch and Profound both export this data. You can pipe it into Looker Studio or a simple spreadsheet.
Layer 3: Content and citation analysis (bi-weekly)
Which pages on your site are being cited by AI engines? Which aren't? This is where you identify the specific gaps -- the topics and questions where AI models want an answer but can't find one on your site.
This layer is the most actionable. It feeds directly into your content calendar. If ChatGPT is citing a competitor's comparison page for a prompt you should own, you know exactly what to write next.
Layer 4: Traffic attribution (monthly)
How much traffic is actually coming from AI search? What's the conversion rate of that traffic compared to organic search? This is the layer that justifies the investment in AI visibility work to finance and leadership.
Google Analytics can capture AI referral traffic if you set it up correctly. Promptwatch also offers a code snippet and GSC integration specifically for this purpose.
Setting up the dashboard: step by step
Step 1: Define your prompt set
Start with 30-50 prompts that represent how your target customers actually search. Think about:
- Category-level questions ("best [category] tools for [use case]")
- Comparison queries ("X vs Y")
- Problem-based questions ("how do I [solve problem your product addresses]")
- Brand-specific queries (your own brand name, your competitors' names)
Don't just guess. Look at your Google Search Console data for the questions driving traffic, check Reddit and Quora for how people phrase questions in your category, and look at your sales team's notes on how prospects describe their problems.
Step 2: Connect a monitoring tool
Pick a tool from the options above and run your prompt set. Most platforms will show you your baseline visibility score within a few hours. This is your starting point -- everything you do from here is measured against it.
If you're serious about optimization (not just monitoring), start with Promptwatch. The Answer Gap Analysis feature will immediately show you which prompts competitors are visible for that you're not -- which is the most useful input you can give your content team.
Step 3: Set up traffic attribution
Before you start creating content, set up attribution so you can measure the impact. Options:
- Install a tracking snippet (Promptwatch provides one)
- Connect Google Search Console to your visibility platform
- Set up server log analysis if you have the technical resources
Without attribution, you'll be improving visibility scores without knowing if it translates to actual traffic or revenue.
Step 4: Build the dashboard views
You don't need a custom data engineering project. Most AI visibility platforms offer Looker Studio integrations or API access. A simple setup:
- Connect your visibility platform to Looker Studio
- Create the four layers described above
- Set up automated weekly email digests for the executive summary
- Schedule a bi-weekly review with your content team to act on the citation analysis
Zapier can automate alerts -- for example, if your visibility score drops more than 5% week-over-week, trigger a Slack notification.
Step 5: Close the loop with content
The dashboard is only valuable if it drives action. The workflow should be:
- Dashboard shows you're missing from prompts in a specific category
- Content team creates a page targeting that gap (using real citation data to understand what AI models want to see)
- You track whether that page gets cited and whether your visibility score improves
- Attribution confirms the traffic impact
This is the cycle that turns a monitoring dashboard into an optimization program. Most teams get stuck at step one because their tools don't help with steps two and three.
Common mistakes to avoid
Tracking too many prompts at once. Start with 30-50 high-value prompts and do them well. Tracking 500 prompts with no prioritization creates noise, not signal. Use prompt volume and difficulty scores (Promptwatch provides these) to focus on prompts that are both high-traffic and winnable.
Ignoring sentiment. A brand mention isn't always a good mention. If ChatGPT is describing your product as "a budget option for teams that can't afford X," that's visibility -- but it's hurting your positioning. Track framing, not just frequency.
Skipping attribution. Visibility scores are meaningless to a CFO. Connect your AI visibility work to traffic and revenue from day one, even if the numbers are small at first.
Only monitoring your own brand. The most valuable insights come from watching your competitors. When a competitor starts appearing in prompts you used to own, that's an early warning signal. When they appear in prompts you've never been in, that's a content opportunity.
Treating this as a one-time project. AI models update their training data and browsing behavior constantly. A visibility score from three months ago tells you very little about today. This needs to be a live, ongoing dashboard -- not a quarterly report.
What good looks like after 90 days
If you set this up properly and act on the insights, here's what you should see after 90 days:
- A baseline visibility score you can track against
- A clear list of content gaps your team is actively working through
- At least a handful of new pages that are being cited by AI engines
- Early traffic attribution data showing AI search as a growing channel
- A weekly rhythm where the dashboard actually influences what your content team works on next
The teams that get the most out of this aren't the ones with the most sophisticated dashboards. They're the ones that close the loop fastest -- find a gap, create the content, track the result, repeat. The dashboard is just the instrument panel for that process.
If you want to skip the manual setup and get straight to the action loop, Promptwatch is the most direct path. The Answer Gap Analysis, built-in content generation, and attribution tracking are all designed to work together -- so you're not stitching together five different tools to do what one platform can handle.