Key takeaways
- Google Search Console now has dedicated Generative AI performance reports (launched June 2026), giving you impression data, page-level breakdowns, and device/country splits for AI Overviews
- A good client report tells a story: where you appear, what you're missing, and what you're doing about it -- not just a table of numbers
- The most useful metrics are AI impression share, citation rate by page, prompt coverage, and trend over time
- Clients don't care about "AI Overviews" as a concept -- they care about whether their brand shows up when buyers ask questions
- Dedicated GEO platforms like Promptwatch go beyond Search Console by showing which specific prompts trigger citations, which competitors are winning, and what content gaps to fix
If you've tried handing a client a screenshot of Google Search Console and explaining what "AI Overview impressions" means, you already know the problem. Their eyes glaze over. They nod politely. Then they ask if their traffic is up.
The challenge with AI Overviews reporting in 2026 isn't data -- it's translation. There's more data available now than ever before, including Google's own dedicated Generative AI performance reports that launched in Search Console in June 2026. The challenge is turning that data into something a client can actually act on, or at least understand well enough to approve your next content sprint.
This guide walks through exactly how to do that.
Why AI Overviews reporting is different from regular SEO reporting
Traditional SEO reports are built around a familiar story: rankings went up, traffic went up, conversions followed. Clients have been trained on this narrative for 15 years.
AI Overviews break that story in two ways. First, appearing in an AI Overview doesn't always drive a click -- the user might get their answer directly in the summary. Second, you can be cited in an AI Overview without ranking in position one, or even in the top ten. The relationship between traditional rank and AI visibility is loose at best.
This means your report needs a new narrative frame. Instead of "we ranked higher," the story becomes "when your potential customers ask AI-powered search about [topic], here's whether your brand shows up, what it says, and what we're doing to improve it."
That's a harder story to tell, but it's the right one.
Step 1: Pull your baseline data from Google Search Console
Google launched dedicated Generative AI performance reports in Search Console on June 3, 2026. If you haven't found them yet, they're separate from the main Performance report and give you a dedicated view of impressions from AI features including AI Overviews and AI Mode.

The report shows:
- Impressions from generative AI features (how often your URLs appeared)
- Which specific pages are being cited
- Country-level breakdowns
- Device splits (desktop vs mobile)
- Date-range filtering down to hourly granularity
For client reporting, the most useful starting point is the pages breakdown. Export the top 20 pages by AI impressions and cross-reference them with your regular organic performance data. You'll often find surprises -- pages that get modest traditional traffic but punch well above their weight in AI citations, or vice versa.
Note that Search Console is still rolling these reports out to a subset of websites, so not every account will have access yet.
Step 2: Layer in prompt-level data
Search Console tells you which pages are being cited. It doesn't tell you why -- which queries triggered the citation, how often your brand appears vs competitors, or what the AI actually says about you.
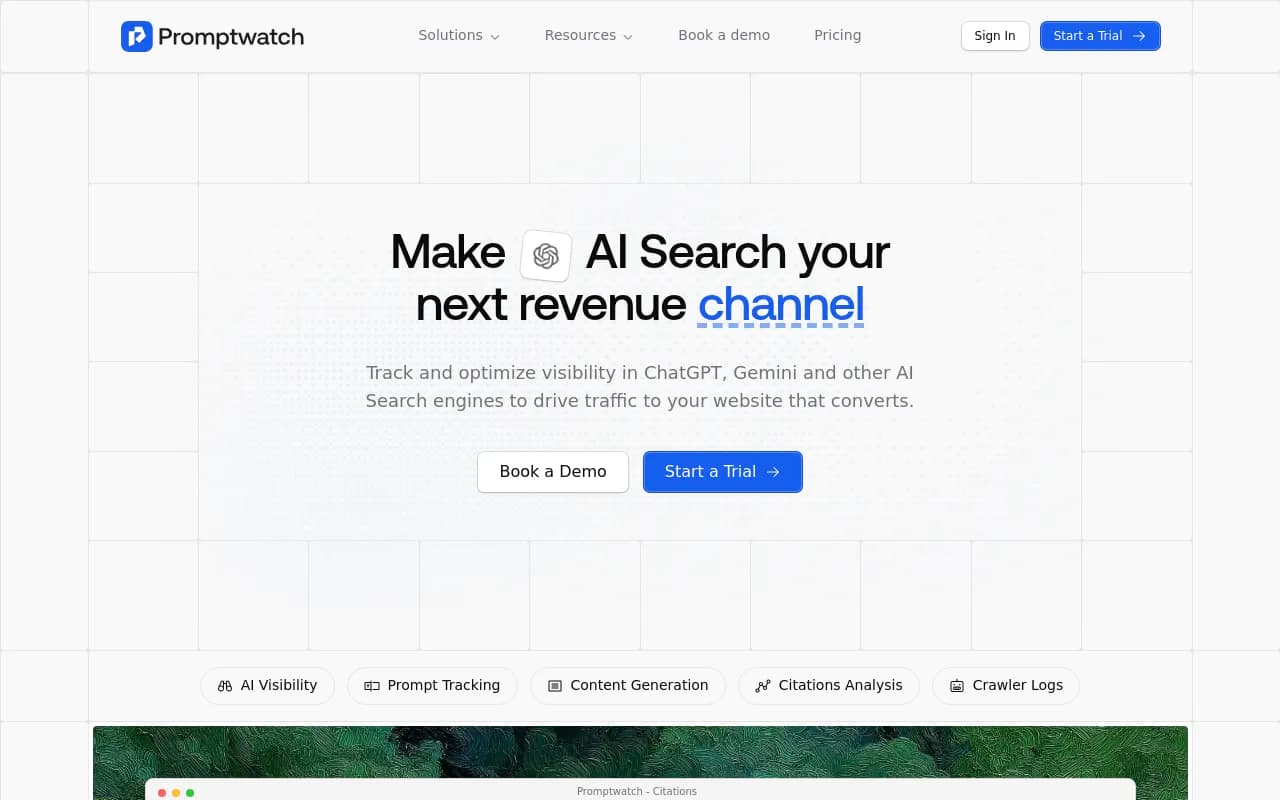
For that, you need a dedicated AI visibility platform. Tools like Promptwatch track how AI search engines respond to specific prompts in real user interfaces, not just through API calls. That distinction matters because what ChatGPT or Google AI Overviews show a real user can differ from what an API query returns.
The prompt-level data you want for client reports includes:
- Which questions (prompts) your client is being cited for
- Which prompts competitors appear in that your client doesn't
- The actual text of AI responses mentioning your client's brand
- Sentiment and positioning within those responses
This is where the report starts to get interesting for clients. Instead of "your AI impressions were 12,400 this month," you can say "when someone asks 'what's the best [your category] for [use case],' your brand appears in the AI answer 68% of the time -- up from 41% last month."
Step 3: Structure the report around three questions
Every client report should answer three questions, in this order:
Where do you appear? This is your current AI visibility snapshot. Use Search Console impression data combined with prompt-level citation rates. Show which topics and pages are generating AI citations, and give a rough sense of how that compares to competitors if you have that data.
Where are you missing? This is the gap analysis. Which high-volume prompts in your category is the AI answering without citing your client? Which competitor pages are getting cited instead? This section is often the most valuable for clients because it turns abstract "AI visibility" into a concrete content to-do list.
What are we doing about it? This is your action plan. New content being created to target specific prompt gaps, existing pages being optimized for better AI citation, and the expected timeline for seeing results.
Clients who understand this three-part structure stop asking "what does this number mean" and start asking "when will we close that gap." That's a much more productive conversation.
Step 4: Choose the right metrics for the client slide
Not every metric belongs in a client-facing report. Here's a practical breakdown of what to include and what to keep in your working documents:
| Metric | Include in client report? | Why |
|---|---|---|
| AI Overview impressions (Search Console) | Yes | Direct from Google, easy to trend over time |
| Citation rate by page | Yes | Shows which content is working |
| Prompt coverage (% of target prompts cited) | Yes | Tells the competitive story clearly |
| Share of voice vs named competitors | Yes, if available | Clients respond to competitive framing |
| AI crawler hits (from crawler logs) | No (keep internal) | Too technical for most clients |
| Query fan-outs | No (keep internal) | Useful for strategy, not reporting |
| Raw impression counts without context | No | Numbers without benchmarks confuse people |
| Month-over-month trend | Yes | Shows momentum |
The prompt coverage metric deserves special attention. If you've defined a set of 50 target prompts for a client (questions their buyers are likely asking AI search engines), and your client is cited in responses to 23 of them, that's a 46% prompt coverage rate. Tracking that number over time gives clients a clear, intuitive sense of progress that "AI impressions" alone doesn't provide.
Step 5: Add the competitive context
Raw numbers without benchmarks feel meaningless. A client seeing "12,400 AI impressions" has no idea if that's good or terrible without knowing what competitors are getting.
Competitor heatmaps -- showing which prompts each competitor is winning -- are one of the most compelling things you can put in front of a client. When they can see that a direct competitor appears in AI answers for 8 of the 10 most important prompts in their category, and they appear in 3, the urgency to invest in AI visibility work becomes self-evident.
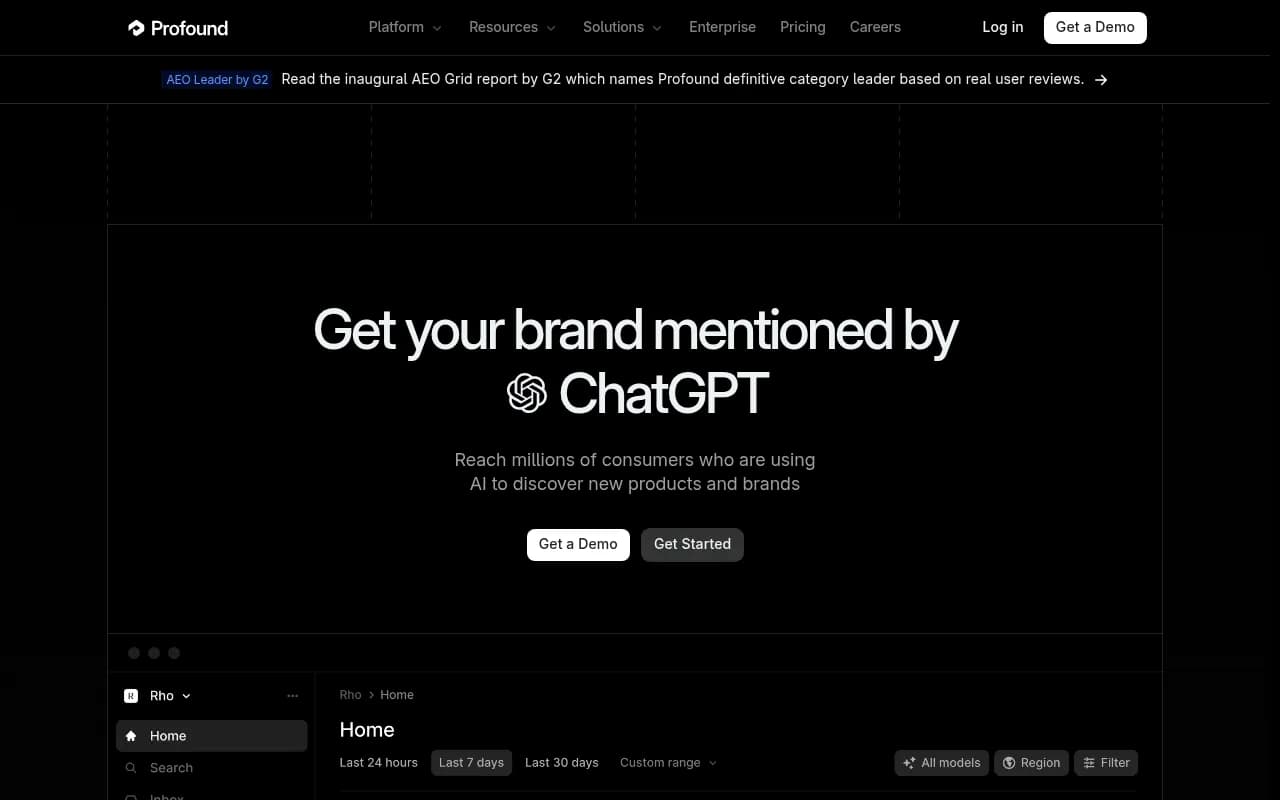
Most traditional SEO tools don't have this data. Platforms built specifically for AI visibility tracking, like Promptwatch, Otterly.AI, or Profound, are where you'll find it.
Otterly.AI

Profound
Step 6: Connect visibility to traffic and revenue
The question every client eventually asks is "but is this actually driving business?" It's a fair question, and the honest answer in 2026 is: it's getting easier to answer, but it's still not perfectly clean.
Google Analytics now shows some referral traffic from AI-assisted search, and platforms like Promptwatch include traffic attribution that connects AI visibility to actual site visits. The connection isn't always one-to-one -- AI Overviews can influence a buyer's decision before they ever click anything -- but you can build a reasonable attribution story by:
- Tracking direct traffic to pages that rank highly in AI citations
- Monitoring branded search volume (AI visibility tends to lift brand awareness, which shows up in branded queries)
- Using UTM parameters on any links that appear in AI-adjacent placements
For clients who want a tighter revenue connection, some platforms offer end-to-end attribution that ties AI crawler activity to eventual conversions. This is still maturing technology, but it's worth including a section in your report on what you're tracking and what you're working toward.
Step 7: Format the report for the audience
A report for a CMO looks different from one for an SEO manager, even if it covers the same data.
For CMOs and executives, lead with the competitive story. One slide showing share of voice vs two or three named competitors, one slide showing the trend, one slide showing the content plan. Keep it to five slides maximum.
For marketing managers and SEO teams, you can go deeper. Include the page-level citation data, the specific prompt gaps you've identified, and the content briefs you're working from. These are the people who will actually execute the work, so they need the detail.
For clients who are new to AI visibility entirely, start with a one-page explainer. Something like: "When your customers search using AI tools like Google, ChatGPT, or Perplexity, they get a summary answer instead of a list of links. This report shows whether your brand is mentioned in those summaries." Simple framing, then data.
Step 8: Set expectations about the timeline
AI visibility doesn't move as fast as paid search, and it doesn't move as predictably as traditional SEO. New content can take weeks to be crawled, cited, and reflected in visibility scores. Clients who expect week-over-week improvements will be disappointed.
A realistic expectation-setting framework:
- Weeks 1-4: Baseline established, prompt gaps identified, content briefs created
- Weeks 4-8: New content published, existing pages optimized
- Weeks 8-16: AI crawlers discover and begin citing new content
- Months 4-6: Meaningful movement in prompt coverage and citation rates
Some clients will see faster results, particularly if they're in categories where AI Overviews are actively pulling from a small pool of sources and there's a clear content gap to fill. But setting conservative timelines and beating them is always better than the reverse.
Tools that make this workflow faster
Building this kind of report manually -- pulling Search Console data, running prompt queries across multiple AI engines, tracking competitors -- is genuinely time-consuming. A few tools worth knowing:
For AI-specific visibility tracking and the prompt-level data that Search Console doesn't provide, Promptwatch is the most complete option available. It covers 10 AI models, includes crawler log analysis, and has content gap analysis built in so you can move from "here's what's missing" to "here's the content we need" without switching platforms.
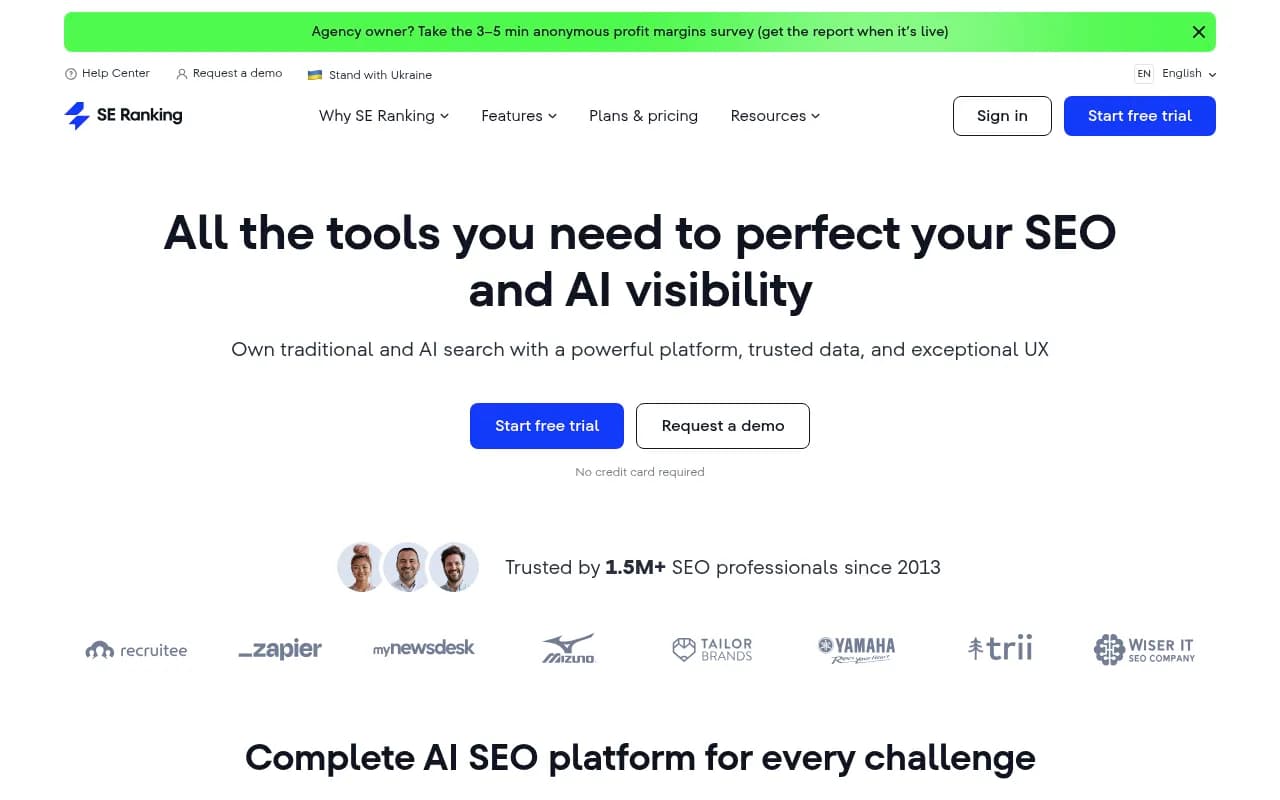
For traditional rank tracking alongside AI visibility, SE Ranking and AccuRanker both have solid agency reporting features and are adding AI search capabilities.
For the content side -- actually creating the articles and pages that will fill the prompt gaps you've identified -- platforms like Frase and Surfer SEO help optimize content for the structural patterns that AI models prefer to cite.
What a good report actually looks like
To make this concrete: a well-structured monthly AI Overviews visibility report for a mid-size B2B client might look like this:
- Executive summary (one paragraph, three bullet points): current prompt coverage, month-over-month change, one competitive highlight
- AI visibility snapshot: Search Console AI impressions trend, top 10 cited pages
- Competitive share of voice: heatmap or table showing client vs 2-3 competitors across 20-30 target prompts
- Gap analysis: 5-10 specific prompts where competitors appear but client doesn't, with estimated prompt volume
- Content actions: what was published this month, what's in progress, what's planned
- Traffic attribution: any measurable connection between AI visibility and site traffic or conversions
Six sections. Fifteen minutes to present. Every number tied to a business question the client actually cares about.
That's the report that gets approved budgets, not confused silence.
The data infrastructure for AI visibility reporting has improved significantly in 2026, with Google's own Search Console now providing dedicated generative AI performance data. The tools are there. The gap most agencies still have is the narrative -- turning crawler logs and impression counts into a story about competitive position and business impact. Get that story right, and the numbers take care of themselves.