Key takeaways
- A board report on AI visibility should answer four things: is demand becoming an owned asset, where do we stand against competitors, what is paid spend doing, and what decision is needed.
- Report six or seven metrics, not forty. Share of voice, citations by engine, AI-referred qualified inquiries, cost per inquiry, and asset durability cover most of what directors care about.
- AI citation data is volatile. Annotate every quarterly trend with engine changes, or the board will read noise as performance.
- Keep definitions identical every quarter and show the same fields each time: current result, prior quarter, owner, threshold status, remediation date.
- Eight to ten slides is plenty. Put the evidence behind each number in an appendix index.
Why AI visibility needs its own board slide
Most boards already see an organic search slide. It shows traffic, rankings and maybe conversions. That slide is quietly becoming misleading. Google Search Console impressions can hold steady while ChatGPT names three competitors and not you, and nothing in your classic report will show it.
The problem for the person presenting is that AI visibility data is messy. Engines cite different numbers of sources, change behavior without notice, and often send visitors with no referrer. A raw dashboard export will not survive a director asking "so is this good?"
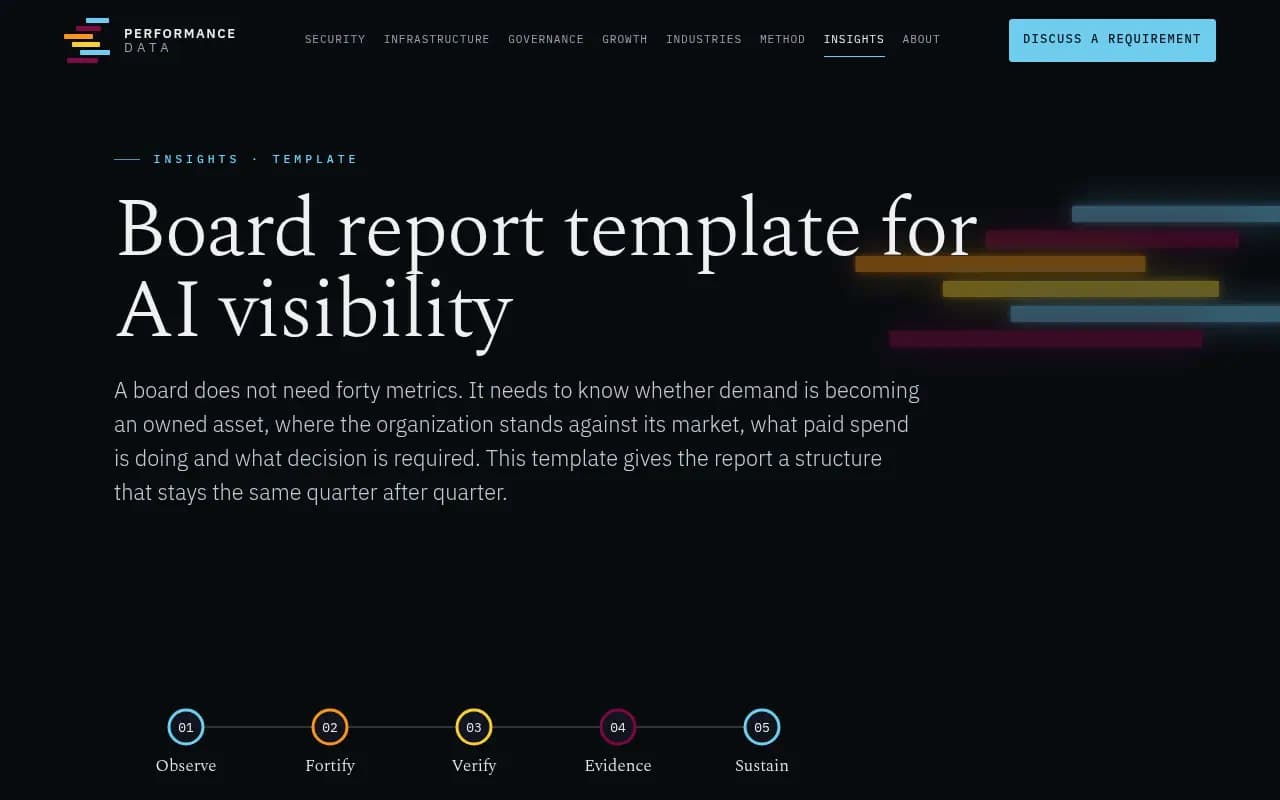
The fix is a short, stable structure. Performance Data's board template for AI visibility puts it well: a board needs to know whether demand is becoming an owned asset, where the organization stands against its market, what paid spend is doing, and what decision is required. Everything else is appendix.
The metrics worth putting in front of a board
Here is the short list I would defend in a boardroom. Each one maps to a question a director might actually ask.
Visibility position
Share of voice and citations by engine, against a defined competitor set, with trend. This is the core number. A visibility score of 30% means little alone but a lot when a competitor sits at 60% and you are closing the gap, as Cognizo's reporting guide points out. Benchmark against the same tracked prompts so the comparison is like for like.
If you are new to the definitions, Share of Voice and Visibility Score are worth reading before you commit to them in a deck. Pick one definition and never change it mid-year.
Qualified demand from AI
Qualified inquiries by source, with the qualified definition written on the slide. This is where most programs fall apart, because AI traffic is hard to attribute. ChatGPT stopped sending a referrer on October 8, 2026, so a tagging convention (such as utm_source=chatgpt.com) matters more than it did. The attributing AI traffic guide covers the options.
Economics
Cost per qualified inquiry by source, paid spend trend, and the share of demand that is earned. Directors understand this framing immediately. It converts a vague visibility story into something they can compare with paid channels.
Owned versus rented
The single most useful question in the template: what proportion of inquiries would continue if paid spend stopped? It is a rough estimate, but it forces the program lead to commit to a number and a method.
Asset durability
Pages published and refreshed, authorship coverage, citations earned. Promptwatch Data's content half-life study gives you a useful benchmark here. It tracked every page ChatGPT cited on July 6, 2026 for 90 days. After 60 days, ChatGPT still cited 69% of landing pages and 67% of docs, while product pages, reviews and how-tos sat around 55%. News was the outlier: half of cited news pages were gone after 36 days.
That gives you a defensible refresh-backlog metric. If your program leans on news-style content, expect to show a decay line and explain it. Landing pages and docs are the durable assets.
Technical access
Whether AI crawlers can read your site and where they fail. It is a unit of risk more than a growth metric, but boards like a green or red status here. Crawler logs make it concrete. Promptwatch Data's AI crawler traffic report shows how quickly the mix of bots shifts, with the Meta-WebIndexer data a good example: it went from about 2% to nearly 38% of tracked AI crawler requests between mid-July and August 9, 2026.
Benchmarks and why they are hard
There are not many stable external benchmarks for AI visibility yet, so most of your benchmarking will be internal and competitive. Three things make comparisons treacherous.
Engines cite different numbers of sources
Promptwatch's average sources per response data (older, from September 2025, so treat it as directional) shows ChatGPT citing about 5 sources per web-search answer, while Google AI Overviews and Perplexity cite about 10. Copilot swung from under 2 to nearly 17 within weeks. A share-of-voice figure is not comparable across engines unless you normalize for this. Show engines separately on the slide rather than one blended number.
Citation behavior changes without warning
A few examples from Promptwatch Data that would have wrecked a naive quarterly trend line:
- On August 14, 2026, reddit.com's share of ChatGPT citations collapsed from about 4% to 0.5% (report).
- From Sep 28 to Oct 4, 2026, ChatGPT drew just 0.46% of its citations from social platforms, while Google AI Overviews drew 12.2% (report).
- On August 8, 2026, ChatGPT started using the site: operator at scale, jumping from about 0.4% to about 17% of fanout queries (report).
- Average citations per ChatGPT response dropped around the GPT-5.3 rollout on March 4, 2026 (report).
If your Q3 visibility dipped because Reddit disappeared from ChatGPT citations, the board should hear that from you, with a date, not discover it later. That is what the change log slide is for.
Authority is not what you think it is
Promptwatch Data's domain rank analysis found that sites with domain rank 46-75 earned almost half of ChatGPT citations in August 2026, while DR 91-100 fell to about 3%. Useful context if a director asks why a smaller competitor is outranking you in answers.
Industry context
Citation sources vary a lot by vertical. For software prompts, GitHub, Microsoft docs and G2 lead ChatGPT citations. For travel, Skyscanner, Going and Tripadvisor lead. In healthcare, NIH, the FDA and the NHS dominate. Pull the report for your vertical so the board sees what a realistic competitor set looks like.
The slide template
The Performance Data template runs ten sections, one page each at most. I would compress it into a deck like this, and keep the order fixed from quarter to quarter.
| Slide | Content | Owner | Evidence |
|---|---|---|---|
| 1. Headline | One paragraph: is the program working against the targets agreed at baseline | Program lead | Baseline and targets document |
| 2. Visibility position | Share of voice and citations by engine vs competitors, with trend | Measurement lead | Share-of-voice report |
| 3. Demand | Qualified inquiries by source and trend, definition stated | Measurement lead | Attribution report |
| 4. Economics | Cost per qualified inquiry, paid spend trend, earned-demand share | Measurement lead | Spend and inquiry reconciliation |
| 5. Owned vs rented | Share of inquiries that continue if paid spend stops | Program lead | Source analysis |
| 6. Asset | Pages published and refreshed, authorship coverage, citations earned, site performance and security | Editorial and technical leads | Asset report |
| 7. Market and engine changes | What changed in the engines, with dates and sources | Program lead | Change log |
| 8. Risks and dependencies | Expert availability, platform changes, compliance review capacity | Program lead | Risk register extract |
| 9. Decisions required | Budget, scope, priorities, with recommendation and reasoning | Program lead | Decision memo |
| 10. Evidence index | Source and method for every figure | Measurement lead | Index table |
Other templates are shorter. Marketing Mary suggests a 4-6 slide quarterly deck for C-suite audiences, and that is a reasonable cut if your board is impatient. Slides 1, 2, 4 and 9 are the minimum.
The fields to repeat every quarter
Open Future Forum's board AI governance report is about governance of production AI systems, not visibility, but its dashboard advice transfers. Show the same fields each quarter: current result, prior-quarter result, management owner, threshold status and remediation date. Directors build intuition from repetition. A metric that appears one quarter and vanishes the next signals that it stopped being flattering.
Diligent's board reporting guidance adds the standard skeleton: executive summary, goals and KPIs, benchmarks, recommendations. Your AI visibility deck is that skeleton with domain-specific content.
A worked example of slide 2
A good visibility slide has one table and one sentence. Something like this:
| Engine | Share of voice Q3 | Share of voice Q2 | Top competitor Q3 | Note |
|---|---|---|---|---|
| ChatGPT | 18% | 21% | 34% | Reddit citations collapsed Aug 14 |
| Google AI Overviews | 24% | 22% | 31% | Social share rising |
| Perplexity | 15% | 15% | 29% | Stable |
The numbers above are illustrative, not real. The sentence beneath: "ChatGPT share fell three points after an engine-level change in source selection, not a change in our content; AI Overviews improved after the pricing page refresh." Cause and evidence, one line each.
Where the data comes from
You will pull from four places. None of them alone is enough.
| Source | What it gives you | Gap |
|---|---|---|
| AI visibility platform | Prompts, mentions, citations, share of voice, sentiment across engines | Does not know your revenue |
| Google Search Console | AI Overviews and AI Mode impressions by page, country, device | No clicks or query data in the generative AI report |
| Bing Webmaster Tools | AI Performance report and Citation Share | Bing and Copilot only |
| Analytics and CRM | AI-referred sessions, qualified inquiries, cost per inquiry | Referrer loss, attribution gaps |
Supermetrics has a thorough walkthrough of combining Search Console, GA4 and citation data into one report, and notes the Search Console generative AI report launched in June 2026 without click, CTR or query data. Keep that limitation in your appendix so nobody asks why impressions have no clicks.
For the visibility layer, a dedicated platform saves a lot of manual work. Promptwatch tracks how ChatGPT, Gemini, Perplexity, Claude, Google AI Overviews and others mention and cite a brand, and it also covers IP-verified AI crawler logs and AI-referred visitor analytics, which feed slides 2, 3 and 6 from one place.
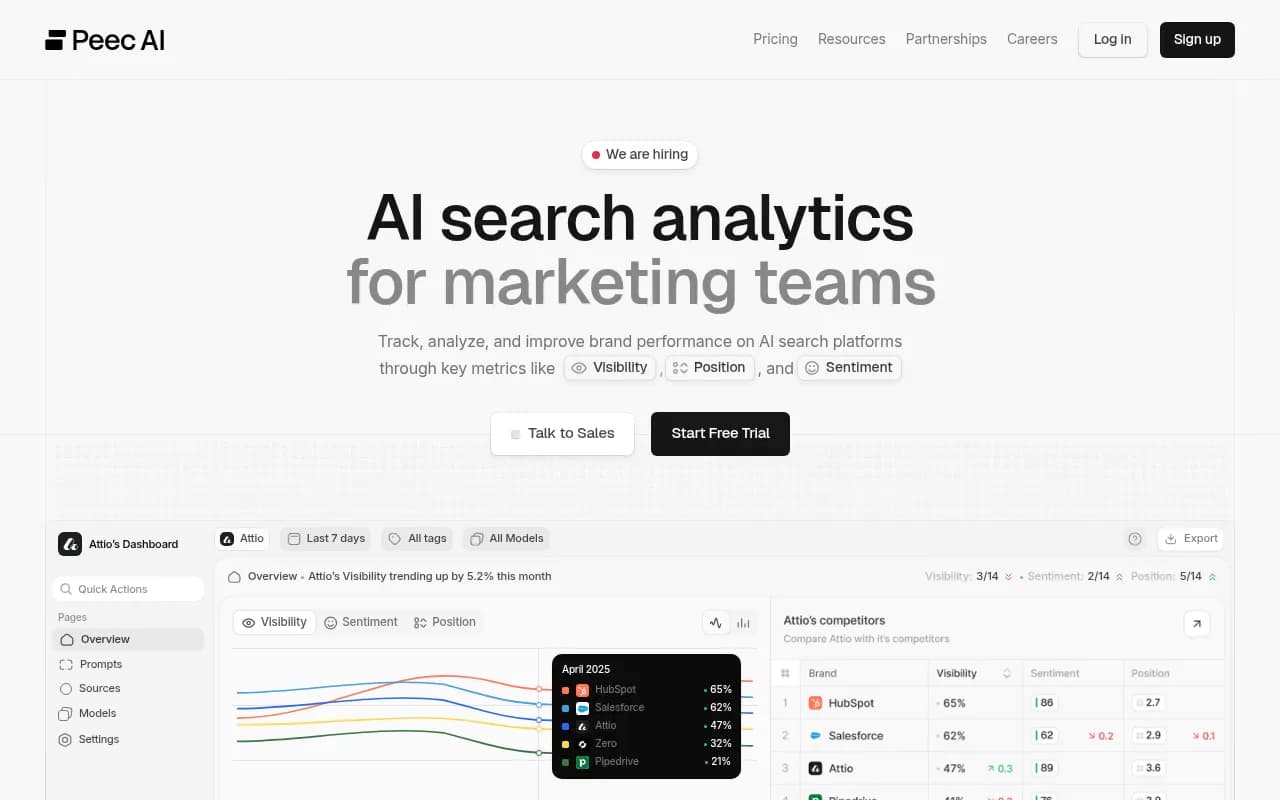
If you want to compare options, the GEO software directory lists many of the category. A few in our catalog that report on AI visibility include Profound for enterprise teams, Peec AI and Otterly.AI as lighter monitoring tools, and Semrush or Ahrefs Brand Radar if you want AI tracking inside an existing SEO suite.
Profound
Otterly.AI

For the free inputs, Google Search Console and Bing Webmaster Tools cover the engine-side impressions, and Google Analytics covers sessions.
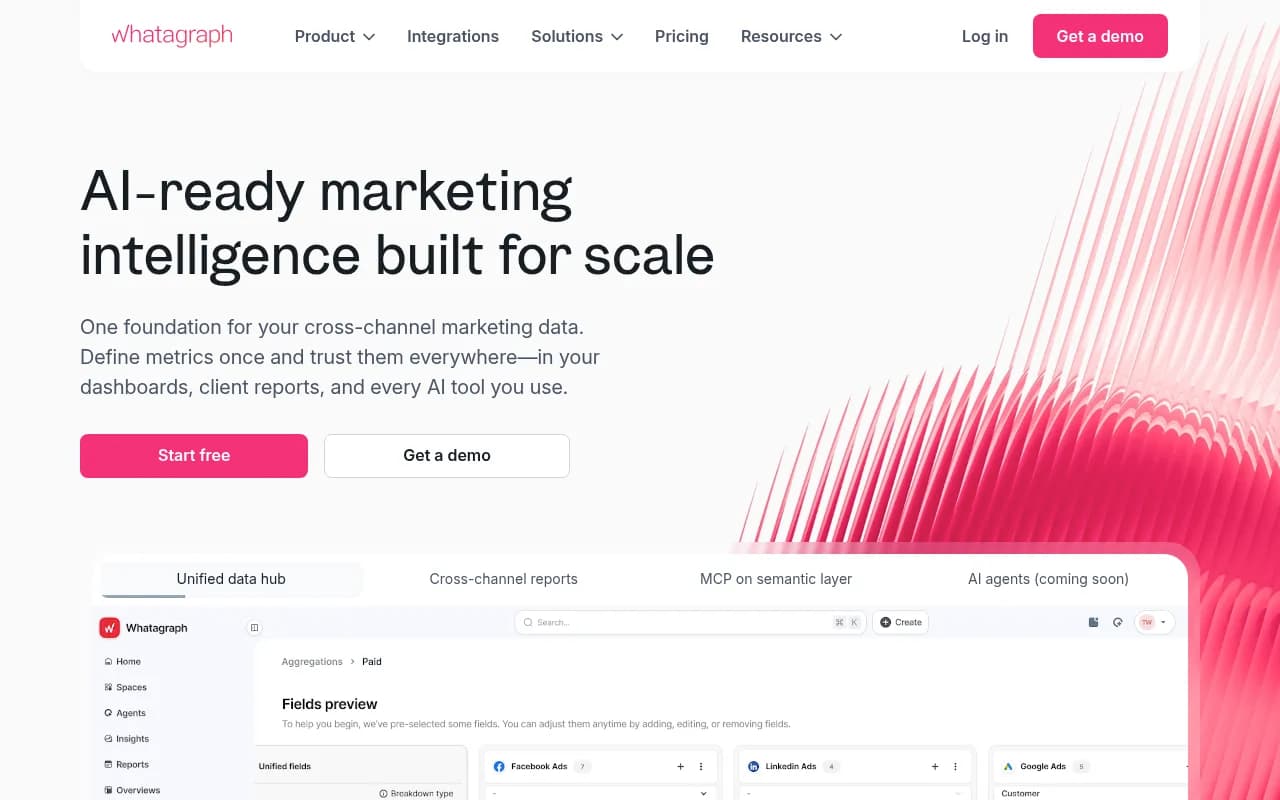
For assembling the deck itself, a BI or reporting tool helps if you refresh it every quarter. Whatagraph and Looker Studio style connectors are common; Whatagraph is in our catalog.
A comparison of the main approaches, honestly:
| Approach | Strength | Weakness | Best for |
|---|---|---|---|
| Manual prompt checks | Free, fast to start | Not repeatable, sample too small | Pre-baseline sanity check |
| Monitoring-only tracker | Cheap share-of-voice trend | No crawler logs, no traffic or content loop | Early-stage reporting |
| End-to-end AI visibility platform | Visibility, crawler access, traffic and content actions together | Higher cost, more setup | Boards that expect decisions, not only charts |
| SEO suite add-on | One login | Fixed prompt sets, shallower AI data | Teams already deep in the suite |
How to run the quarterly cycle
The report is the end of a process. Skip the process and the deck will be improvised in the final week.
- Set the baseline and targets once, in writing. Slide 1 compares against these, so they cannot move.
- Freeze the prompt set and competitor set for the year. Add prompts only with a note in the change log.
- Report monthly internally, using the same definitions. The quarterly board deck is a rollup of the monthly evidence report.
- Keep a running change log of engine events with dates and source links. You will need it for slide 7.
- Write the decision memo first. If you cannot state what you want from the board, the rest of the deck has no point.
- Fill the evidence index last. Every figure needs a source and method. If a number cannot be sourced, cut it.
A decision is the point of slide 9. Typical ones: shift budget from paid to content refresh, approve a technical fix for crawler access, extend scope to a new market, or hire an expert reviewer for regulated content.
Mistakes I see in these reports
- Presenting a single blended visibility score across engines. Sources per response differ, so it hides more than it shows.
- Showing a dip without a cause. The board assumes the team did something wrong.
- Changing the definition of qualified inquiry between quarters.
- Reporting prompts tracked or mentions counted as outcomes. Those are inputs.
- Forgetting risk. Platform dependency is a real risk when one engine changes behavior overnight.
- Overdoing the appendix. Ten pages of screenshots will not be read; an index table will.
Quick checklist before you send it
- Does slide 1 answer "is it working?" in one paragraph?
- Is every metric defined the same way as last quarter?
- Are engine changes annotated with dates?
- Does every number have a source and method in the index?
- Is there at least one decision requested?
- Is the competitor set stated?
If you want the deeper programmatic side, the 90-day GEO program is a sensible way to set the baseline that your first board report compares against. And if the report is going to a board that wants an outside view of the program, 1001 SEO Media runs this kind of AI search reporting for clients, though the template above works fine in-house.
The short version: fix the structure, keep the definitions boring, annotate the volatility, and ask the board for something specific.