Key takeaways
- Brand-level AI visibility and local AI visibility are different measurements. Multi-location brands need both, but only local data tells you which store, clinic, or branch to fix.
- Don't track every prompt at every location. Use a tiered setup: a small core prompt set everywhere, a bigger set for your top markets, and a rotating sample for the rest.
- Track prompts with the location written in and without it. You can't assume the AI will add a city for you.
- One prompt tells you very little. Judge locations on averages across many prompts, plus position and how the AI describes you.
- The tool matters less than the loop: measure, find the cause (usually listings, reviews, or local pages), fix it, re-check.
Why local AI visibility is its own problem
A homeowner with a burst pipe asks an AI assistant for an emergency plumber. The answer depends on where they are prompting from, which geographic terms they use, and which plumbers have a real presence nearby. Localogy's October 2026 piece draws the line well: brand-level visibility measures how often AI mentions a brand in general, often for queries with no geography. Local visibility reveals where a business actually earns recommendations.
For a brand with 40, 400, or 4,000 locations, this creates an arithmetic problem. Ten prompts, five AI platforms, and 400 locations is 20,000 data points per check. Nobody reads that. So the real job is deciding what not to track.
Brand-level versus location-level: what each one tells you
| Question | Brand-level tracking | Location-level tracking |
|---|---|---|
| Does AI know we exist? | Yes | Partly |
| Which branch is missing from "best dentist near me" answers? | No | Yes |
| How is our reputation described? | Yes | Yes, per market |
| Which competitors win in Denver but not Dallas? | No | Yes |
| What do we fix first? | Hard to say | Often obvious |
A blended brand score hides the spread. A brand can look healthy overall because 30 locations carry it while 100 are invisible. Averages are the enemy here.
Be wary of tools that say "location-level" but give you a single score per address. Local Falcon makes the point that a business can be strong two miles north of its storefront and absent two miles south, and a single number per location never shows that. For most multi-location brands a per-location score is enough to prioritize. For service-area businesses, a grid view matters more.
Build a tiered tracking plan
The way out of the data flood is a tiered plan. Here is the structure I'd start with.
Tier 1: the core prompt set, every location
Pick 5 to 8 prompts that represent how customers really ask. Include a mix:
- Category plus city: "best urgent care in Austin"
- Category plus "near me" or neighborhood
- A service-specific prompt: "same-day crown dentist Austin"
- One branded prompt: "is [Brand] Austin any good"
- One comparison prompt against your main local competitor
Write each prompt once with the location in it and once without. ChatGPT may or may not add geography itself. Promptwatch's query fanout data shows that average fanout queries got short, about 53 characters or six to eight words in April 2026, so you can't count on the model expanding a vague prompt into a city-specific search. Test both versions and compare.
Tier 2: deeper sets for top markets
Your highest-revenue 10 to 20 percent of locations deserve 20 to 30 prompts, including persona variants ("family looking for a hotel" versus "business traveler"), seasonal queries, and competitor comparisons.
Tier 3: a rotating sample for the long tail
For the remaining locations, check the core set weekly or monthly, and rotate in extra prompts for a random subset each cycle. You are looking for outliers, not perfect coverage.
Why you need many prompts per location
AI answers are noisy. In Promptwatch's unique domains per response data (Sep 28 to Oct 4, 2026), 47.6% of ChatGPT responses with citations cited 10 or more domains, and for organic prompts with no brand named that rose to 52.5%. Your location shares every answer with a crowd. One missed mention on one prompt is a coin flip. A pattern across eight prompts is a signal.
That also means "mentioned or not" is a thin metric. Track position in the answer, whether the description is accurate (hours, services, address), and sentiment.
Metrics that survive scale
Pick a handful and stick with them.
- Recommendation rate per location: the share of tracked prompts where the location is recommended. SOCi's 2026 Local Visibility Index calls its version "% Recommended" and reports that AI platforms recommend brands far less often than traditional search does.
- Position when mentioned: first recommendation or fifth.
- Accuracy: wrong phone number, closed-hours errors, a branch that moved.
- Citation sources: which sites the AI leans on for your locations (your own pages, Yelp, directories, review sites).
- Competitor gap: where one competitor repeatedly outranks you.
Report by exception. A weekly view that lists the 10 worst-performing locations and the 10 biggest movers beats a 400-row table every time.
Choosing a tool by team type
Tools in this space fall into a few buckets. Uberall's buyer guide groups them similarly, though note it is vendor-authored and Uberall sells in one of the categories, so verify claims in demos.
| Category | Examples | Best for | Watch out for |
|---|---|---|---|
| Local rank trackers with AI add-ons | Local Falcon, BrightLocal, Local Dominator | Agencies and SMB owners who already track local packs | Mostly measurement; the fixing happens elsewhere |
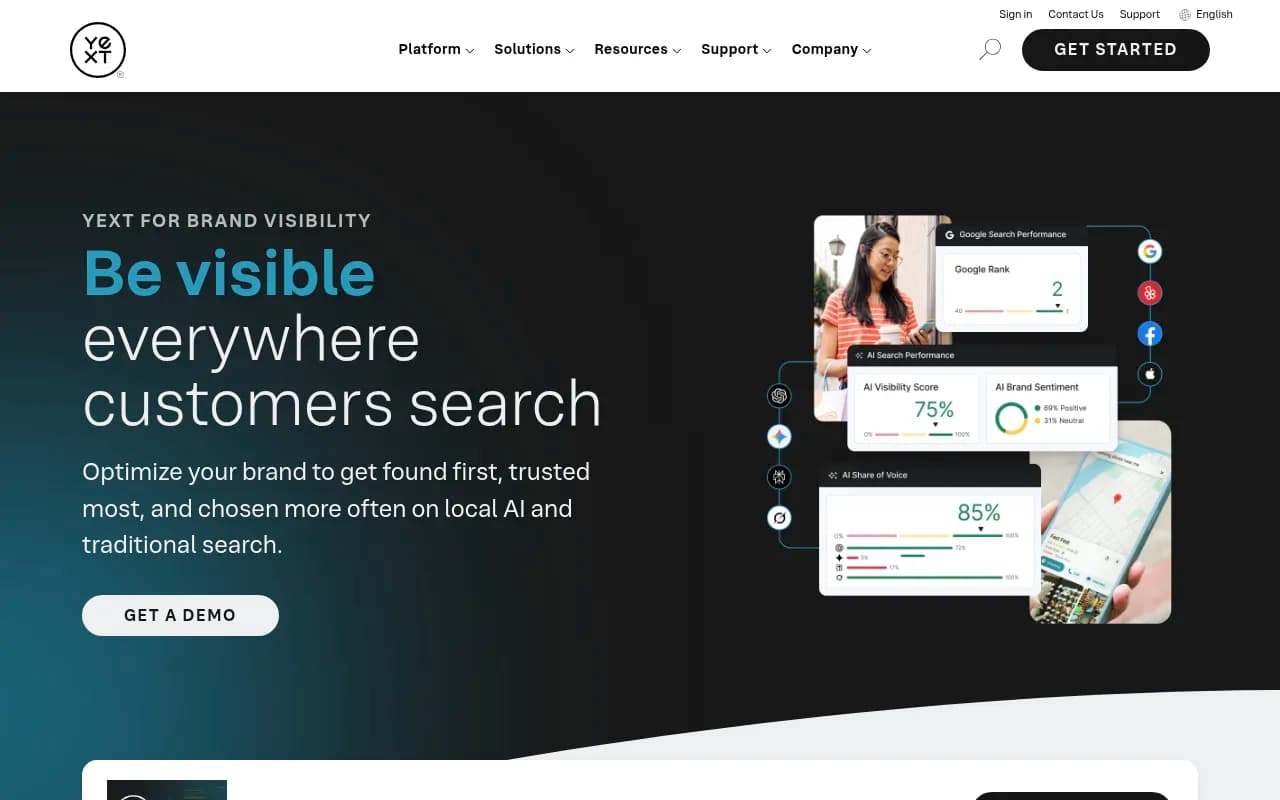
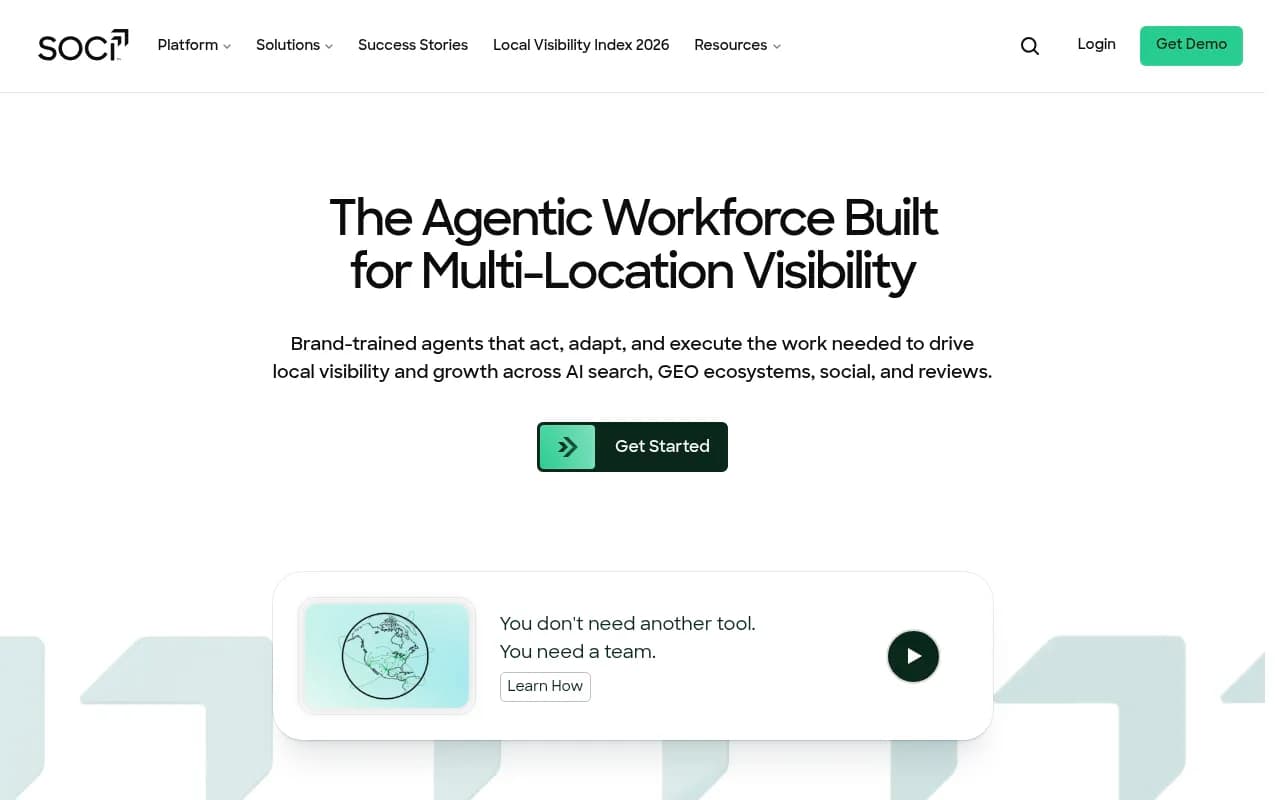
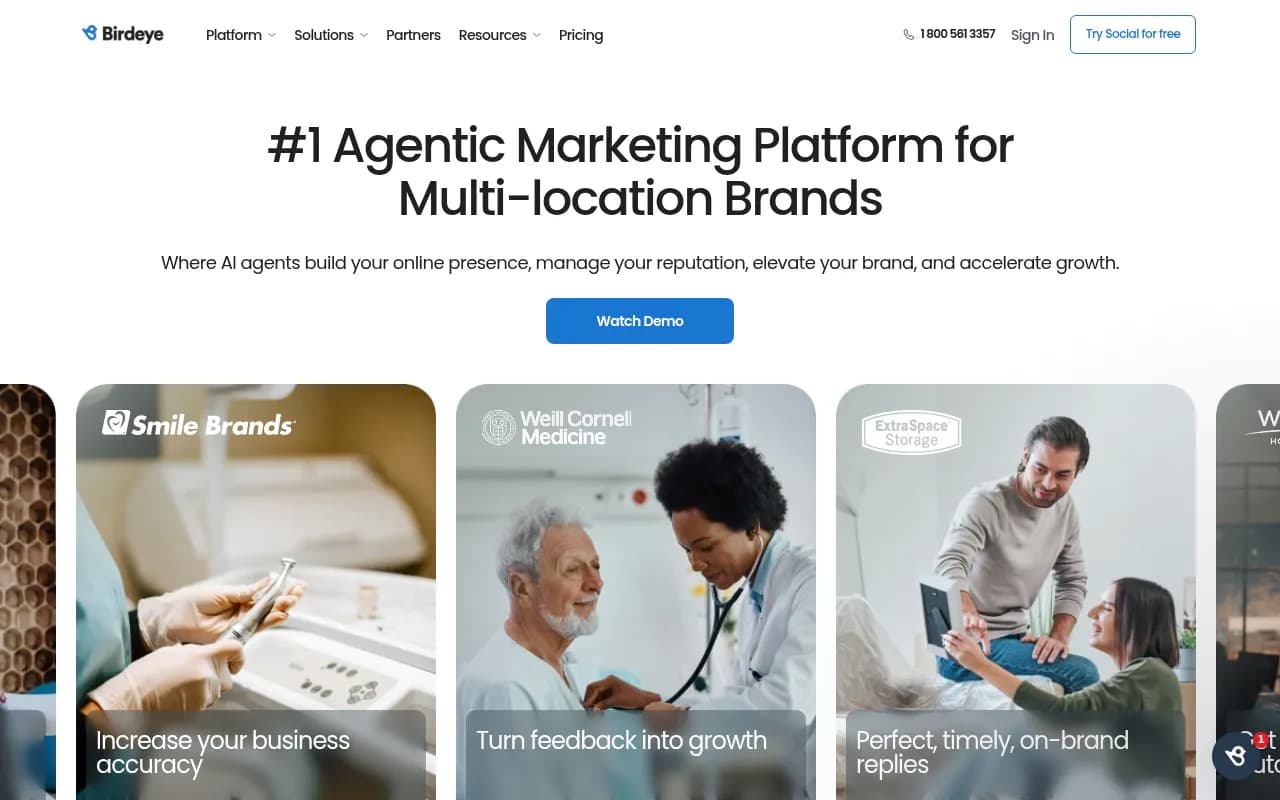
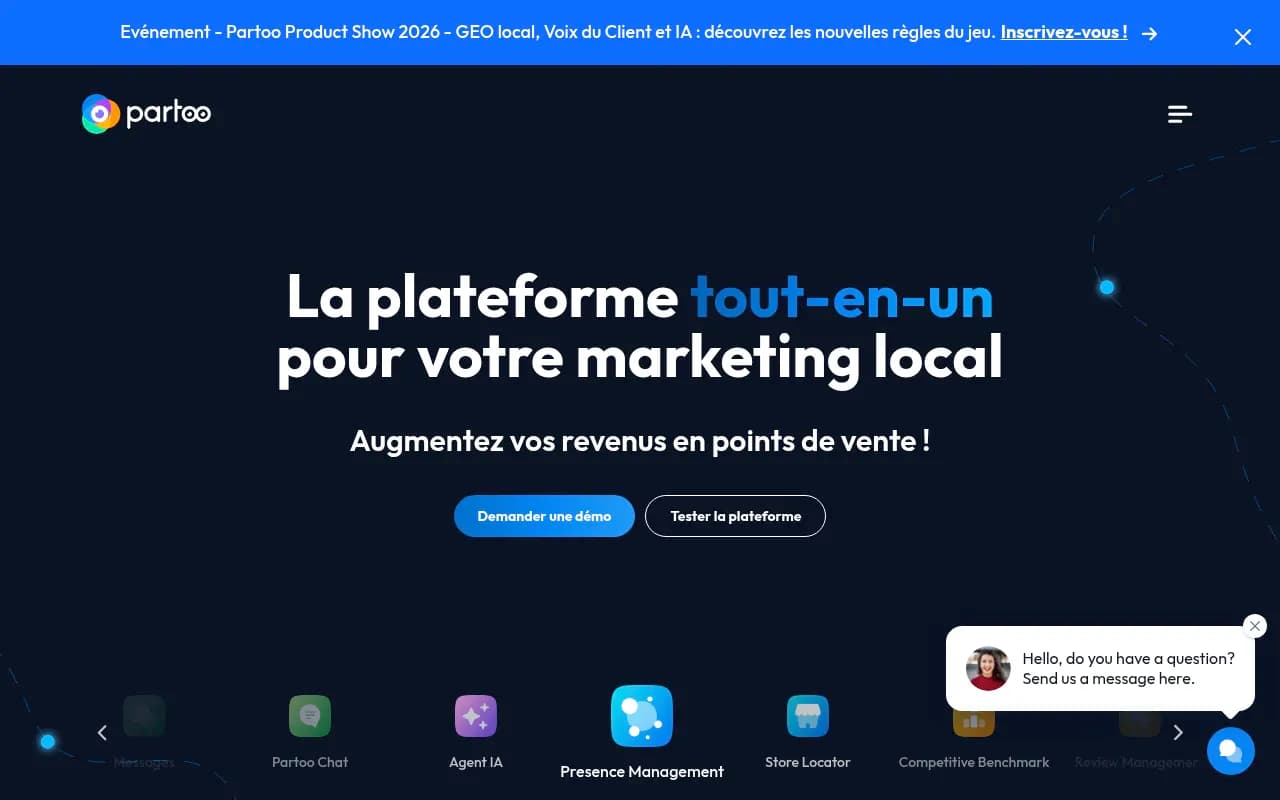
| Listings and reputation platforms adding GEO | Yext, Uberall, SOCi, Birdeye, Partoo | Brands that need to fix listing and review data at scale | Ask for results from customers beyond the beta, and watch pricing and complexity |
| AI visibility platforms | Promptwatch, Profound, Peec AI | Deep prompt, citation, and competitor analytics | Check how location-level tracking works in practice |
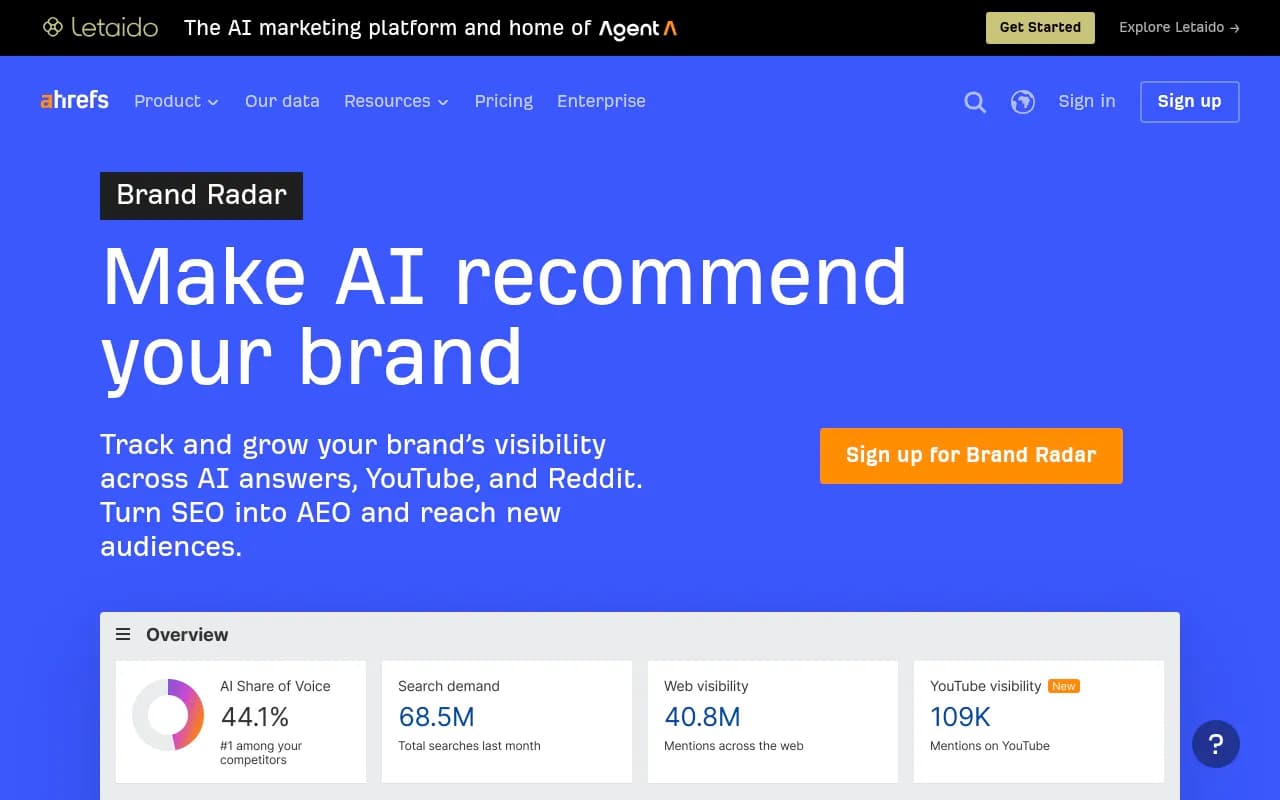
| SEO suites with AI modules | Semrush, Ahrefs Brand Radar | Teams already living in those suites | Fixed prompt sets and shallower AI-specific data |
Local-first trackers
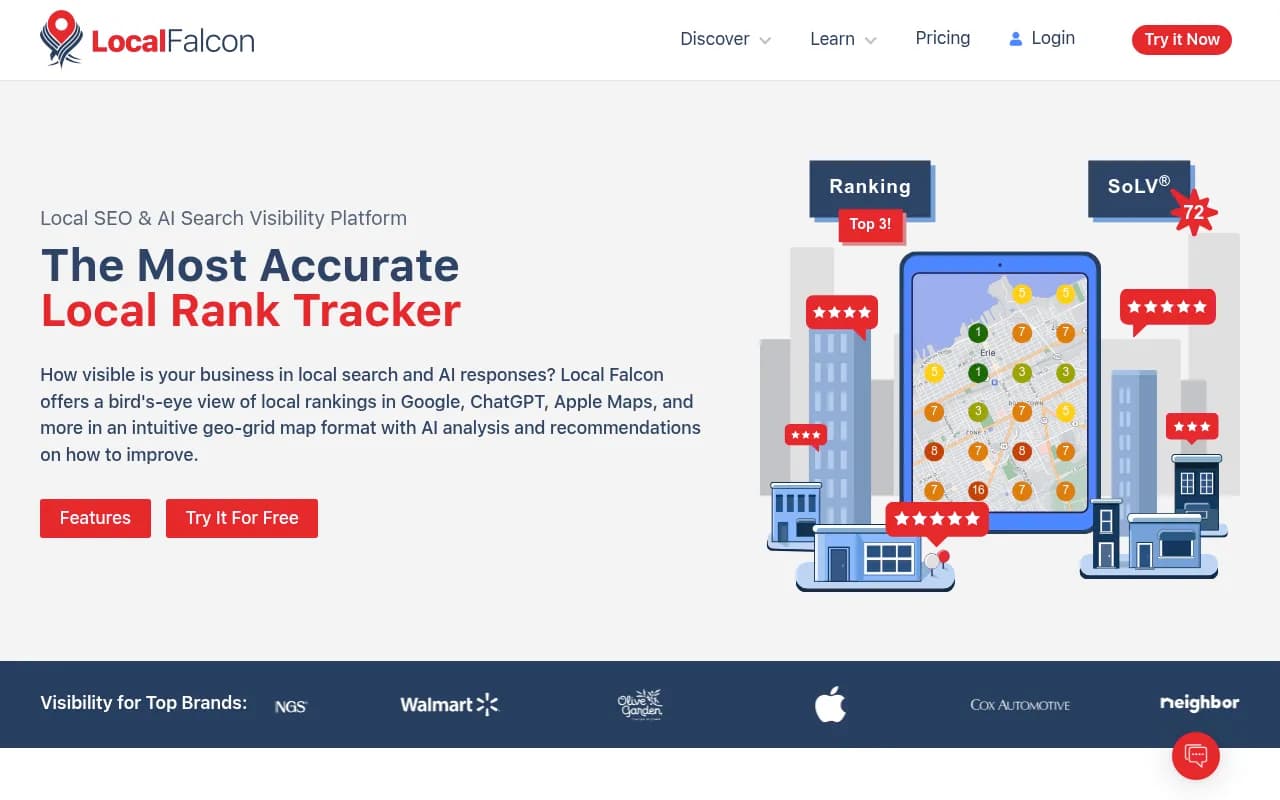
Local Falcon runs the same prompt from different GPS points across an area and records the response, brand list, rank position, and citations at each point. That gives you a heatmap, not just a number. Its AI tracking is included in every plan and uses the same credit system as its grid rank tracking, per its own documentation.
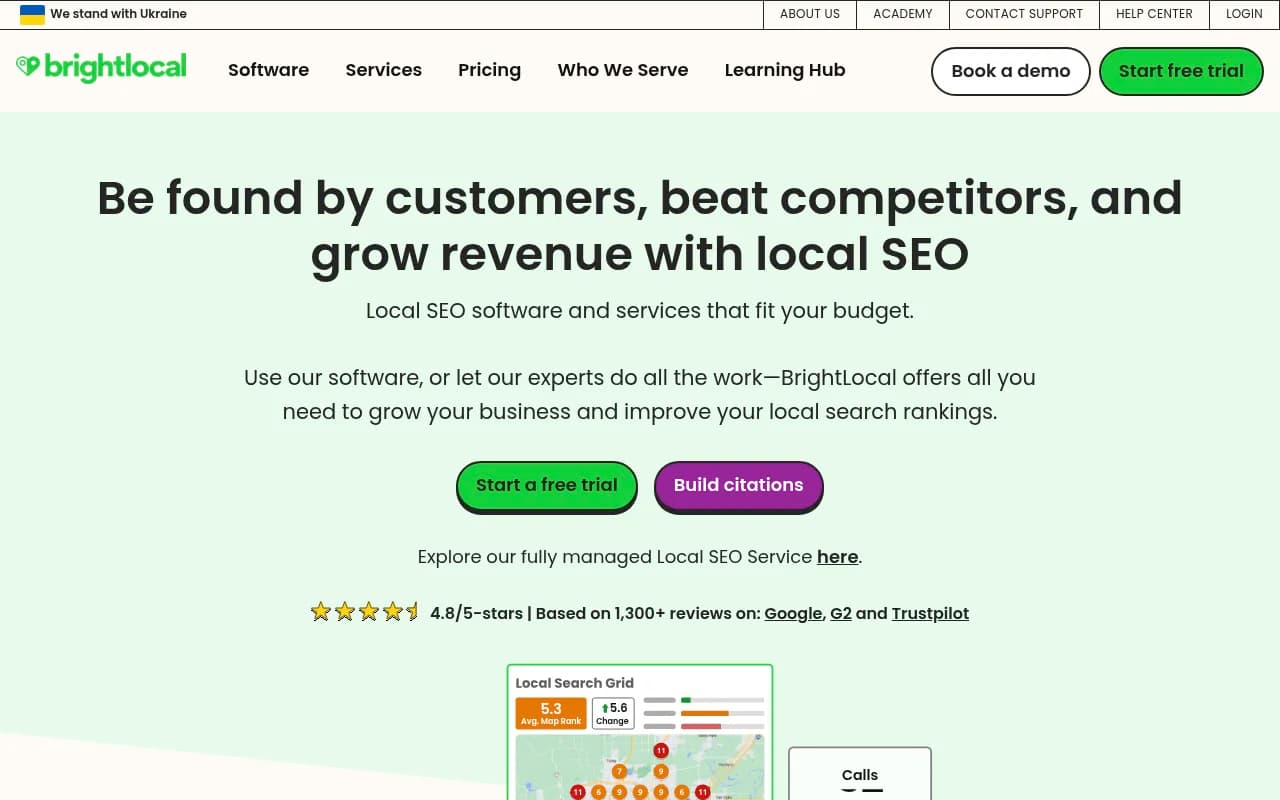
BrightLocal scores each location from 0 to 100 across ChatGPT, Google AI Mode, and Google AI Overviews, with up to 20 prompts per location. Its pitch is that rankings, reviews, citations, and AI visibility live in one login, which suits agencies. It also cites a survey figure that 58% of consumers have used AI to find or get a recommendation for a local business, which is the vendor's number, so treat it as directional.
Listings and reputation platforms
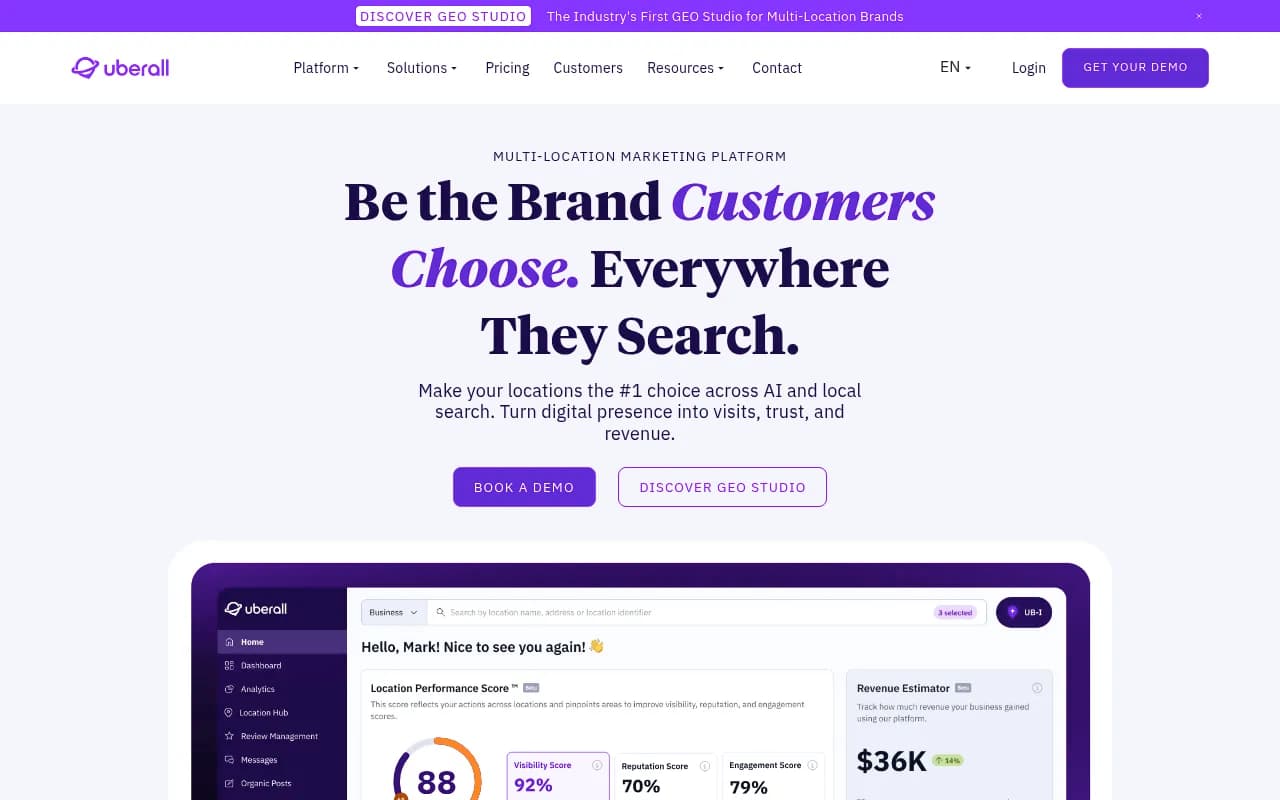
The argument for Uberall and Yext is that AI models draw on your Google Business Profile, Yelp, Apple Maps, directories, and reviews, so the system that fixes those should sit next to the measurement. If your visibility problem at 80 locations is bad listing data, that is where the cure lives. Yext has been described as premium-priced and complex, which matters if your team is small.
SOCi, Birdeye, and Partoo approach it from social, reviews, and listings. Partoo outsources AI measurement to Meteoria, so you contract with two vendors for one view, according to Uberall's guide. Check that before signing.
AI visibility platforms
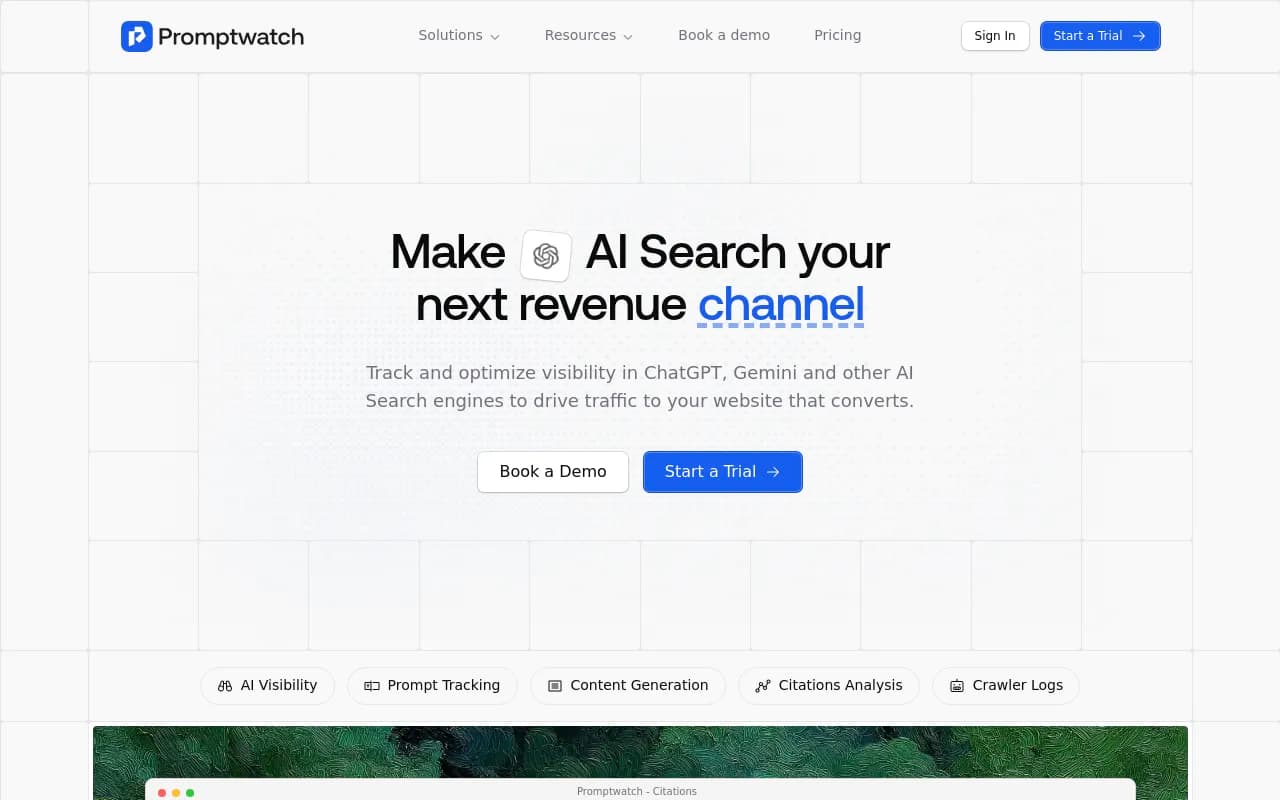
When you need to understand why AI recommends someone else and what to publish about it, a dedicated platform helps. Promptwatch tracks the real interfaces of ChatGPT, Google AI Overviews, AI Mode, Gemini, Perplexity, and others by country, with state and city tracking from the Business plan. Its prompt volumes, query fan-outs, and citation analytics show which sources AI pulls from, and the Action Board turns gaps into a prioritized to-do list. Its AI crawler logs also show whether AI bots can read your location pages at all. It isn't a listings manager, so pair it with one if your data is messy.
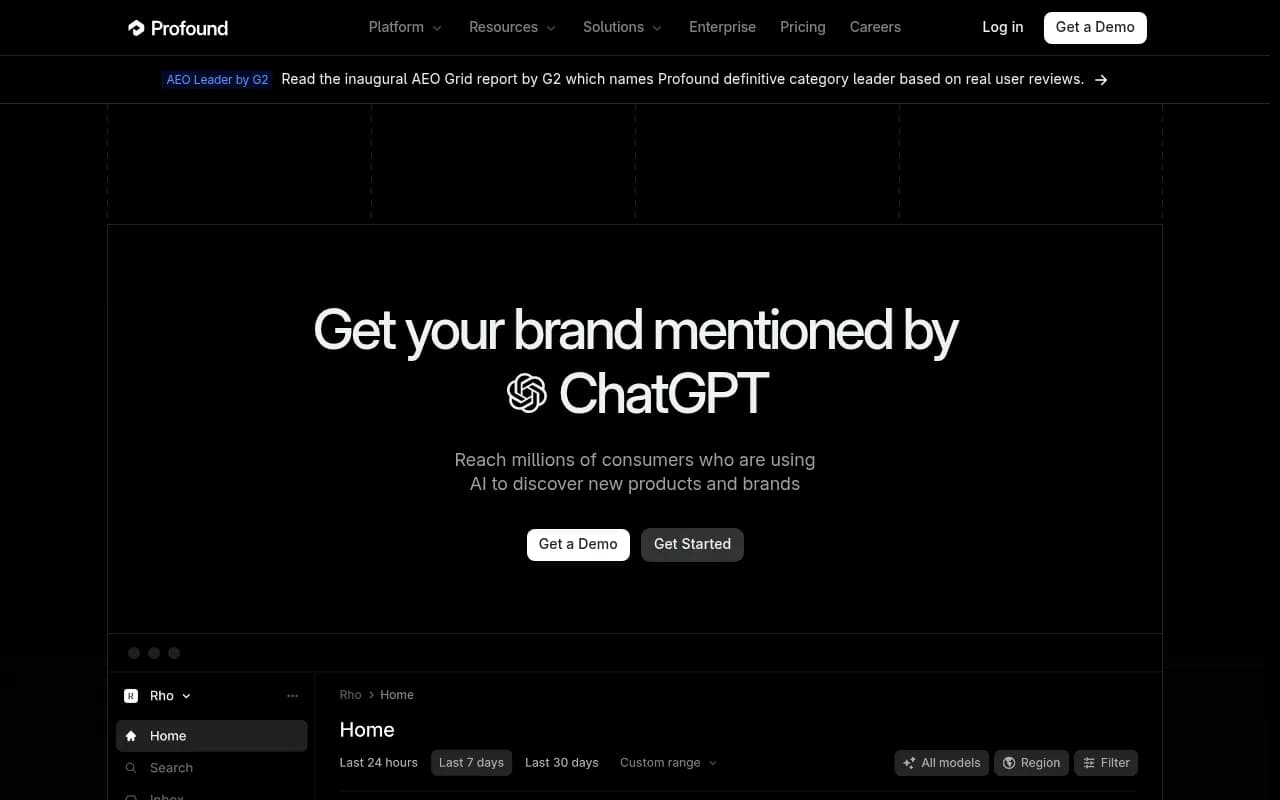
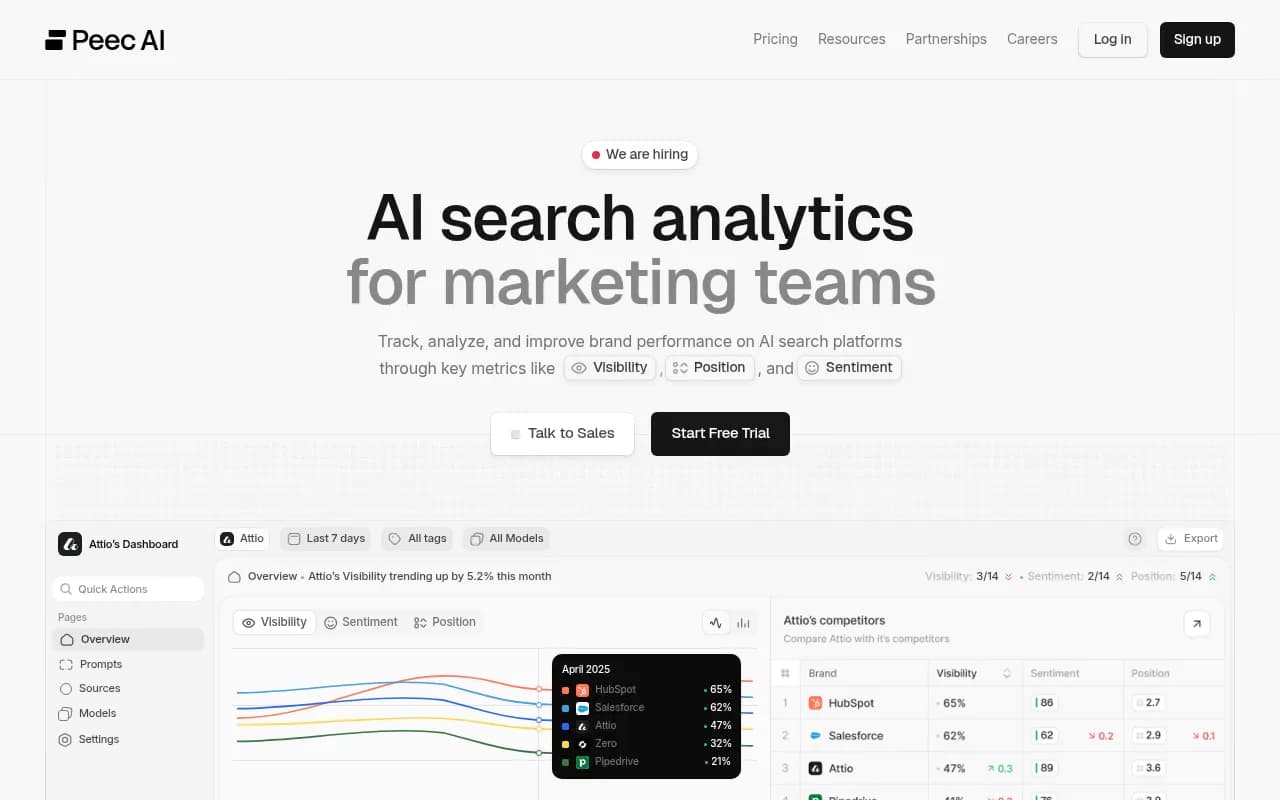
Profound and Peec AI are strong on analytics and support location-specific tracking according to Uberall's guide. Semrush and Ahrefs Brand Radar add AI tracking to existing workflows.
Profound
For wider comparisons, the GEO software directory and the AI rank tracking tools directory list many more options.
Compare quotes by cost per answer
AI visibility tools price on usage. The only fair comparison across vendors is cost per AI response per month, with your location count and prompt count multiplied in. Ask vendors who is quoting a default package without asking how many locations you have. A vendor who doesn't ask about your locations, data source, or who will use the tool is guessing.
Set up the workflow in five steps
1. Clean the inputs first
Before tracking anything, audit location data: names, addresses, phone numbers, hours, and categories across Google Business Profile, Apple Maps, Yelp, and major directories. LinkedIn commentary on this topic puts it well: brands that already manage location data well are the ones AI can quote with confidence. Tracking bad data just produces a precise picture of a mess.
2. Segment your locations
Group by market size, revenue, competition level, and region. Tier 1, 2, and 3 above map onto these groups.
3. Define prompts and personas
Write prompts the way customers speak, short and specific. Add two or three personas if your business serves distinct groups. Keep a shared spreadsheet or tool tag so every location gets the same core set. Consistency matters more than cleverness, because you want to compare locations.
4. Choose a cadence
Weekly for Tier 1 and 2 locations, monthly for the long tail. AI answers shift quickly, and a platform update can move everything at once. Promptwatch Data recorded ChatGPT's citations of reddit.com dropping from about 4% to 0.5% overnight on August 14, 2026 (report). Platform shifts like that can change local results too, so annotate your charts with known updates before blaming a store manager.
5. Diagnose by cause, then assign an owner
When a location underperforms, check in order:
- Is the listing data wrong or incomplete?
- Are reviews thin, stale, or unanswered?
- Does the location have its own page with real local content?
- Which sources does the AI cite for this market, and are you on them?
- Which competitor is winning and why?
Assign fixes to the right team: central marketing for templates and listings, local managers for reviews and photos, and a content owner for local pages.
Avoiding the common traps
Looking at one prompt in one city and calling it a trend. Averaging across all locations so the bad ones disappear. Counting a mention as a win when the AI gets your hours wrong. Buying a tool that measures beautifully and fixes nothing. And tracking everything because the plan has room for it, then reading none of it.
A useful test of your setup: can a regional manager open a single view and know the three things to do this week? If not, cut data until they can.
What a sensible monthly report looks like
- Brand-level recommendation rate and trend (one chart)
- Top 10 and bottom 10 locations by recommendation rate
- Locations with accuracy errors, with the wrong detail quoted
- Top competitor gaps by market
- Fixes shipped last month and whether the affected locations moved
That is one page. Everything else lives in the tool for drill-down.
Final take
Local AI visibility doesn't need more data. It needs a small, consistent prompt set, a tier system that spends effort where revenue is, and a clear route from a low score to a fix. Pick a tool that matches where your actual bottleneck sits, whether that is measurement, listings, or content, and run the loop monthly. If you can't name the cause of a location's weak showing within a few minutes, your tracking is too broad or your inputs are dirty.