Felt Review 2026
Cloud-based GIS platform for creating, editing, and sharing maps collaboratively in real-time. Intuitive interface designed for non-technical users.
Summary
- Best for: Teams needing fast, collaborative spatial visualization without GIS expertise -- urban planners, environmental consultants, logistics teams, data analysts, and newsrooms
- Standout strength: Upload Anything feature instantly geocodes addresses, parses geometry, and visualizes any file format (CSV, Shapefile, GeoJSON, etc.) without manual data prep
- Key limitation: Advanced spatial analysis capabilities are lighter than desktop GIS tools like QGIS or ArcGIS Pro -- this is a visualization and collaboration platform first
- Pricing: Free tier available; Team plan $200/month (billed annually); Enterprise custom pricing
- Notable: SOC 2 Type 2 compliant with enterprise SSO, VPC deployment, and authenticated embeds for security-conscious organizations
Felt is a cloud-native GIS platform launched to modernize how teams create and share spatial data visualizations. Founded by former Uber and Facebook engineers Sam Hashemi (CEO) and Can Duruk (CTO), the company raised significant venture funding and has been adopted by organizations ranging from The New York Times to city governments to mobility companies like Lyft and Lime. The core promise: make mapping as easy as creating a Google Doc, with real-time collaboration and zero software installation required.
The platform targets a specific pain point -- traditional GIS tools like ArcGIS and QGIS have steep learning curves, require desktop installation, and make collaboration difficult. Felt removes those barriers with a browser-based interface that non-technical users can navigate immediately, while still offering enough power for professional spatial workflows.
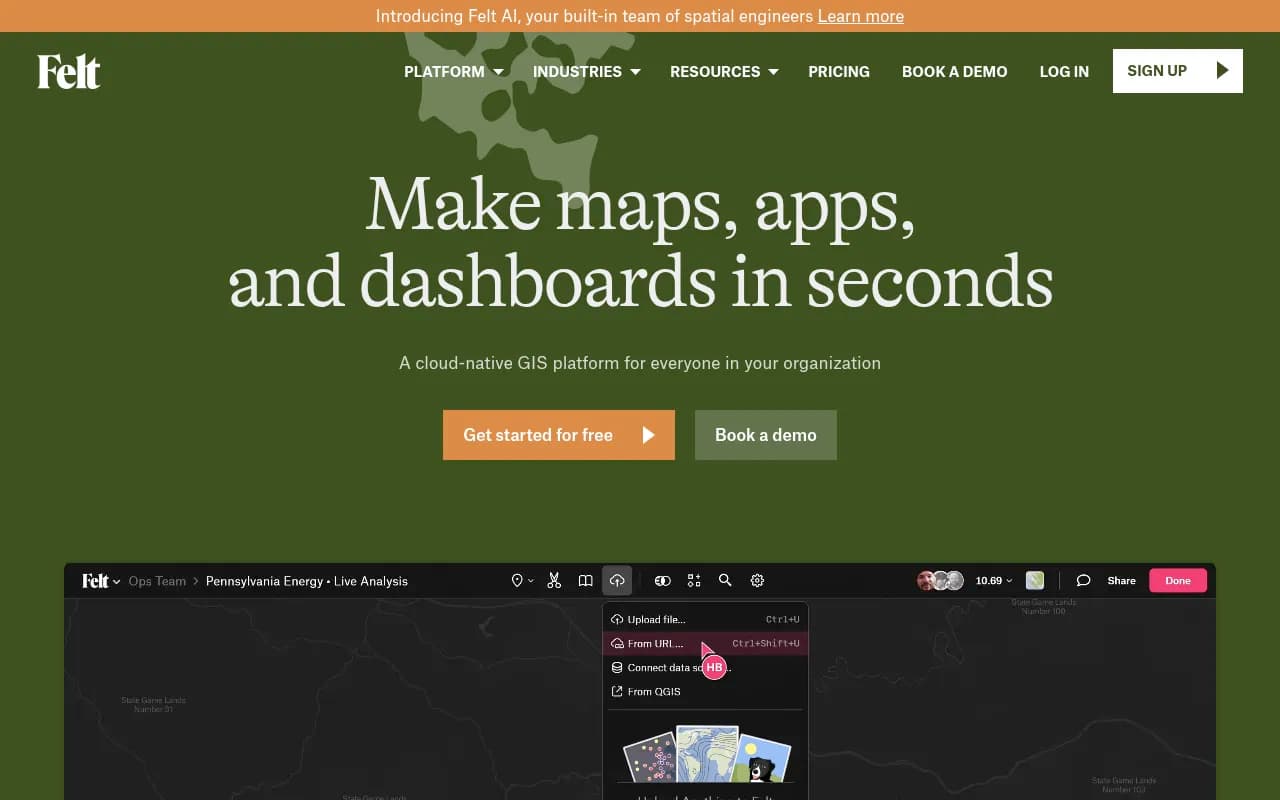
Upload Anything: The Data Ingestion Differentiator
Felt's headline feature is Upload Anything, which handles the tedious data preparation that normally consumes hours in traditional GIS workflows. Drag a CSV with street addresses into Felt and it automatically geocodes them to map points. Drop a spreadsheet with city names and it geomatches boundaries. Upload a file with latitude/longitude columns buried among dozens of other fields and Felt parses the geometry automatically.
Supported formats include CSV, Excel, Shapefile, GeoJSON, KML, GeoPackage, GeoTIFF, and more. The platform applies intelligent cartographic defaults immediately -- choropleth maps get sensible color ramps, point data gets clustered at appropriate zoom levels, and legends generate automatically. This is a massive time-saver compared to QGIS or ArcGIS where you manually configure symbology, projections, and layer styling.
Behind the scenes, Felt runs a proprietary data processing engine that handles coordinate system transformations, spatial indexing, and rendering optimization. Maps with millions of features load smoothly because the platform uses vector tiles and server-side rendering. For raster data like satellite imagery, Felt supports Cloud Optimized GeoTIFFs (COGs) and STAC catalogs for efficient streaming.
Live Database Connections
Felt connects directly to cloud data warehouses and databases: Postgres, Snowflake, BigQuery, Databricks, Microsoft SQL Server, Amazon S3, Google Cloud Storage, Azure Blob Storage. You can also pull from WFS/WMTS services and ESRI ArcGIS Online.
These are live connections, not one-time imports. When your source data updates, maps refresh automatically. This is critical for operational dashboards tracking real-time logistics, infrastructure monitoring, or emergency response. The data stays in your warehouse -- Felt queries it on-demand and caches tiles for performance.
For teams already invested in modern data stacks (dbt, Fivetran, Airflow), this integration model fits naturally. You can build spatial transformations in SQL, store results in Snowflake, and visualize in Felt without exporting files or managing duplicate datasets.
Dashboards and Interactive Visualizations
Felt's dashboard builder lets you create time-series charts, histograms, category filters, and statistical summaries alongside maps. Click a bar in a histogram and the map filters to show only those features. Scrub a timeline and watch spatial patterns change over time. This is spatial business intelligence -- the kind of interactivity you'd expect from Tableau or Looker, but with geography as the primary dimension.
Use cases include: tracking delivery fleet performance across regions, monitoring environmental sensor data over time, analyzing real estate trends by neighborhood, or visualizing election results with demographic overlays. The dashboard components are drag-and-drop configurable, and you can embed the entire dashboard on a website with an iframe.
Compared to building custom web maps with Mapbox GL JS or Leaflet, Felt dashboards require zero code. Compared to static maps in Tableau or Power BI, Felt offers richer spatial interactions and better cartographic control.
Collaboration and Sharing
Multiple users can edit the same map simultaneously with live cursor tracking and change syncing -- think Google Docs for maps. You can leave comments pinned to specific map locations, tag teammates, and resolve threads. This is invaluable for project review workflows where planners, engineers, and stakeholders need to discuss site locations or design options.
Sharing options include:
- Public links: Anyone with the URL can view (useful for public engagement or journalism)
- Guest access: Invite external collaborators from other organizations without requiring Felt accounts
- Team workspaces: Organize maps into folders with role-based permissions (viewer, editor, admin)
- Embeds: Drop an iframe on your website with customizable controls and branding
- Authenticated embeds: Require SSO login to view embedded maps (Enterprise only)
Permission controls are granular. You can make a map view-only for clients while keeping editing restricted to your team. Or allow public comments on a planning proposal without letting the public edit the underlying data.
Developer Tools and Extensibility
Felt offers a Python SDK and REST API for programmatic map creation and data management. Use cases include:
- Automating map generation from nightly data pipelines
- Bulk uploading datasets from S3 or GCS
- Embedding Felt maps in custom web applications with JavaScript API controls
- Exporting map data as GeoJSON or GeoPackage for use in other tools
The QGIS plugin lets you push layers from QGIS Desktop directly to Felt for web sharing. This bridges the gap between desktop GIS analysis and cloud-based collaboration -- do heavy spatial processing in QGIS, then publish results to Felt for stakeholder review.
Felt also supports JavaScript-based map interactions via their embed API. You can programmatically control zoom, layer visibility, and feature selection from your own web app. This makes Felt a viable backend for custom spatial applications without building your own tile server and rendering pipeline.
Spatial Analysis Capabilities
Felt recently introduced SQL Queries for spatial analysis at scale. You can run PostGIS-style spatial SQL directly in the browser:
- Buffer geometries (e.g. "show all parcels within 500m of this highway")
- Spatial joins (e.g. "count how many incidents occurred in each police district")
- Aggregations (e.g. "sum population by census tract")
- Filtering and transformations
Results render instantly on the map. This is a major step toward making Felt a full analysis platform, not just a visualization tool. However, it's still not a replacement for QGIS or ArcGIS Pro for complex geoprocessing workflows (network analysis, terrain modeling, advanced raster math). Felt's analysis is focused on common spatial queries that support decision-making, not exhaustive GIS operations.
Other built-in transformations include:
- Heatmaps and density surfaces
- Choropleth mapping with data-driven styling
- Point clustering
- Line and polygon simplification for performance
- Coordinate system reprojection
Felt AI: Prompt-Driven Map Creation
Felt AI (launched mid-2025) lets you describe a map in natural language and have it built automatically. Example prompts:
- "Show me all coffee shops in Brooklyn with a 10-minute walk radius"
- "Create a choropleth of median income by county in California"
- "Map wildfire perimeters from the last 5 years with burn severity"
The AI agent geocodes locations, fetches relevant datasets (from Felt's library or your connected databases), applies appropriate styling, and generates a shareable map. It can also write SQL queries for spatial analysis and create dashboard components.
This is genuinely useful for exploratory analysis and rapid prototyping. Instead of manually searching for datasets, uploading files, and configuring layers, you describe the outcome and Felt builds it. The quality depends on prompt clarity and data availability, but for common use cases (demographic mapping, site analysis, infrastructure visualization), it works surprisingly well.
Compared to ChatGPT or Claude generating static maps, Felt AI produces interactive, editable maps you can refine and share. It's more like a spatial copilot than a one-shot map generator.
Enterprise Security and Compliance
Felt is SOC 2 Type 2 compliant, meaning it has passed rigorous third-party audits for security controls. All web traffic uses TLS encryption, credentials are encrypted at rest, and data is stored in U.S.-based AWS regions. The platform monitors for DDoS attacks and maintains 99.9% uptime SLAs for Enterprise customers.
Enterprise features include:
- SSO integration: Enforce SAML-based single sign-on via Okta, Azure AD, Google Workspace, etc.
- VPC deployment: Host Felt in your own AWS VPC for complete data isolation
- Authenticated embeds: Require SSO login to view embedded maps on your website
- Audit logs: Track who accessed which maps and when
- Custom data retention policies
For government agencies, healthcare organizations, and financial services firms with strict data governance requirements, these features are table stakes. Felt competes directly with ESRI ArcGIS Online and Carto in this space, with a more modern interface and faster performance.
Who Should Use Felt
Best fit:
- Urban planning teams (5-50 people) collaborating on zoning maps, infrastructure projects, and public engagement
- Environmental consulting firms creating site assessment maps, wetland delineations, and impact visualizations for client reports
- Logistics and operations teams at mobility companies (Lyft, Lime, Turo) tracking vehicle fleets, service areas, and demand hotspots
- Newsrooms and data journalism teams (New York Times uses Felt) building interactive maps for stories on deadline
- Real estate and commercial development teams analyzing market trends, site suitability, and demographic overlays
- Government agencies (cities, counties, state DOTs) publishing public-facing maps for transparency and community input
- Non-profits and advocacy groups mapping environmental justice issues, public health data, or community resources
Not ideal for:
- Heavy GIS analysts who need advanced geoprocessing (network analysis, 3D terrain modeling, hydrological modeling) -- stick with QGIS or ArcGIS Pro
- Teams with zero cloud budget -- the free tier is limited, and serious use requires the $200/month Team plan
- Organizations requiring on-premise deployment -- Felt is cloud-only (though Enterprise VPC is available)
- Users needing offline mapping -- Felt requires internet connectivity
Pricing Breakdown
Free Plan:
- Unlimited public maps
- Upload up to 20 layers per map
- 10 GB storage
- Basic sharing and embedding
- Community support
Good for: Individual users, students, hobbyists, or small non-profits creating simple public maps.
Team Plan ($200/month, billed annually):
- Everything in Free
- Unlimited private maps
- Unlimited layers per map
- 1 TB storage
- Live database connections (Postgres, Snowflake, BigQuery, etc.)
- Advanced permissions and team workspaces
- Priority support
- SQL queries and spatial analysis
- Dashboard builder
- QGIS plugin and Python SDK access
Good for: Small to mid-size teams (5-20 people) doing professional spatial work. This is the sweet spot for most organizations.
Enterprise Plan (custom pricing):
- Everything in Team
- SSO and SAML integration
- VPC deployment
- Authenticated embeds
- Audit logs
- Custom data retention
- Dedicated account manager
- SLA guarantees
- Volume discounts for large teams
Good for: Large organizations (100+ users), government agencies, or any team with strict security and compliance requirements. Pricing typically starts around $1,000/month depending on user count and features.
Value Assessment: Compared to ESRI ArcGIS Online (starts at $500/year per user for basic features, $2,500/year for Creator licenses), Felt is significantly cheaper for teams. A 10-person team on Felt Team plan pays $2,400/year total. The same team on ArcGIS Online Creator would pay $25,000/year.
Compared to Carto (starts at $199/month for basic, scales to $1,000+ for enterprise), Felt is competitively priced with a more intuitive interface.
Compared to Mapbox Studio (free for low usage, $5 per 1,000 monthly active users for web apps), Felt is more expensive but requires zero coding and includes collaboration features Mapbox lacks.
Strengths
- Upload Anything is genuinely magical: Eliminates 80% of data prep work that makes traditional GIS painful
- Real-time collaboration: Multiple editors, live cursors, threaded comments -- finally brings Google Docs UX to mapping
- Performance at scale: Handles millions of features smoothly with vector tiles and server-side rendering
- Live database connections: Keeps maps synced with your data warehouse without manual exports
- Modern developer experience: Python SDK, REST API, QGIS plugin, JavaScript embed API
- Enterprise-grade security: SOC 2 Type 2, SSO, VPC deployment, authenticated embeds
- Beautiful defaults: Maps look professional immediately without manual styling
Limitations
- Limited advanced GIS analysis: No network analysis, 3D visualization, or complex geoprocessing -- this is not a QGIS replacement for heavy spatial analysis
- Cloud-only: Requires internet connection, no offline mode
- Free tier is restrictive: 20 layers per map and 10 GB storage fills up quickly for real projects
- Pricing jumps sharply: $0 to $200/month is a big leap for small teams or freelancers (no $50-100/month middle tier)
- Raster analysis is basic: Can display rasters but limited tools for raster math, classification, or band combinations compared to QGIS or ERDAS
Bottom Line
Felt is the best cloud-native GIS platform for teams who need to create, share, and collaborate on spatial visualizations without GIS expertise. If your workflow involves uploading data, making maps, and sharing them with stakeholders -- and you're tired of emailing static PDFs or wrestling with ArcGIS Online -- Felt is a massive upgrade. The Upload Anything feature alone saves hours per week, and the real-time collaboration makes spatial projects feel modern instead of stuck in 2005.
For organizations doing heavy spatial analysis (hydrological modeling, network routing, advanced raster processing), Felt is a complement to QGIS or ArcGIS Pro, not a replacement. Use desktop GIS for analysis, then publish results to Felt for collaboration and sharing.
Best use case in one sentence: Urban planning teams, environmental consultants, and logistics operations that need fast, collaborative spatial visualization with live data connections and zero GIS learning curve.
Frequently asked questions
What is Felt mapping software?
How much does Felt cost?
Is Felt free to use?
Who is Felt best for?
What is Felt's Upload Anything feature?
How does Felt compare to ArcGIS and QGIS?
Does Felt support real-time collaboration?
Is Felt secure for enterprise use?
Similar and alternative tools to Felt