Key takeaways
- Report GEO on three layers: visibility (citation rate, share of voice), traffic (AI referral sessions and crawler activity), and outcomes (conversions and revenue matched in your CRM).
- Use a fixed, intent-segmented prompt set so month-over-month changes mean something. Commercial, informational and branded prompts behave differently.
- AI referral traffic is undercounted because many AI visits arrive without a referrer. Say so up front, and show citations next to traffic instead of pretending analytics tells the whole story.
- Published conversion multipliers range from 2.3x to 23x depending on the study. Don't promise a client any of them. Measure their own numbers.
- A one-page scorecard with a baseline, a trend line and a short list of next actions beats a 40-slide deck.
Why GEO reporting is harder than SEO reporting
In classic SEO you can point at a ranking, a click and a conversion. The chain is visible. GEO breaks that chain in at least three places.
First, a brand can be named in an AI answer without any click. SparkToro estimated that roughly 7 in 10 Google searches now end without a click, and AI answers push that further. Second, when a click does happen, the referrer is often stripped, so the visit lands in direct traffic. Third, AI answers vary between runs, so a single screenshot proves very little.
That doesn't mean GEO is unprovable. It means you have to prove it with several kinds of evidence that point the same way. A client who sees citation rate going up, AI referral sessions going up, and AI-sourced leads going up will believe it. A client who only sees a screenshot of ChatGPT mentioning them will, rightly, be skeptical.
The three-layer proof model
I find it easiest to structure every GEO report around three layers. Each answers a different client question.
| Layer | Client question | Core metrics | Typical source |
|---|---|---|---|
| Visibility | Are AI engines naming us? | Citation rate, share of voice, position, sentiment | Prompt-tracking platform or scripted runs |
| Traffic | Is anyone arriving from AI? | AI referral sessions, landing pages, AI crawler visits, impressions in Search Console | GA4, server logs, Search Console |
| Outcomes | Is it worth money? | Leads, signups, pipeline, revenue from AI-sourced visits | CRM plus analytics match |
The layers matter because they fail differently. Visibility can rise while traffic stays flat (AI is naming you but not linking). Traffic can rise while outcomes stay flat (wrong pages are getting cited). Reporting all three tells the client where the leak is instead of just that there is one.
Layer 1: prove visibility with a fixed prompt set
Build the prompt set once and freeze it
The most common mistake is changing the prompts every month. Then nobody can tell whether the numbers moved because of your work or because the sample changed.
Pick 50 to 100 prompts that mirror how the client's buyers actually research. Contently and Maintouch both suggest running a fixed set repeatedly across ChatGPT, Perplexity, Gemini and Google AI Overviews. Maintouch recommends running each prompt several times because answers vary. I agree, and I would go further: report the average across runs, not the best run.
Segment by intent
Promptwatch's data on ChatGPT citation share by content type (Sep 28 to Oct 4, 2026) shows why you shouldn't blend prompts together. Product pages were 22.4% of all ChatGPT citations, landing pages 16.8% and listicles 13.6%. But commercial prompts leaned harder on product pages (26.0%) and landing pages (20.6%), while informational prompts gave more room to how-tos (10.7%) and docs (8.5%). You can read the full breakdown in Promptwatch's ChatGPT citation share by content type report.
So report commercial, informational and branded prompts as three separate lines. A client whose branded citation rate is 80% but whose commercial rate is 6% has a very different problem from one with the reverse.
The core visibility metrics
Citation rate is simple: queries where your brand or domain is cited, divided by queries tested. Test 100, appear in 28, you are at 28%. Share of voice puts that next to competitors. If a rival appears in 42% of the same prompts, the gap is the story.
Discovered Labs publishes rough benchmarks from its own B2B SaaS audits: 8-15% is a baseline, 20-30% is optimized, 40-50%+ is category leadership. Treat those as one agency's observations, not an industry standard. They are useful as a rough sanity check, not as a promise.
Also track position within the answer and sentiment. Mentions without self-citations (the AI names you but links someone else) usually point to a content or crawlability problem, and that is worth flagging in the report.
Tools for the visibility layer
You can do this with scripts and a spreadsheet for a small client. For anything bigger, a tracking platform saves hours. Tools like Promptwatch track real ChatGPT, AI Overviews, Gemini and Perplexity interfaces, and add crawler logs and visitor analytics, which is what you need to connect layers one and two.
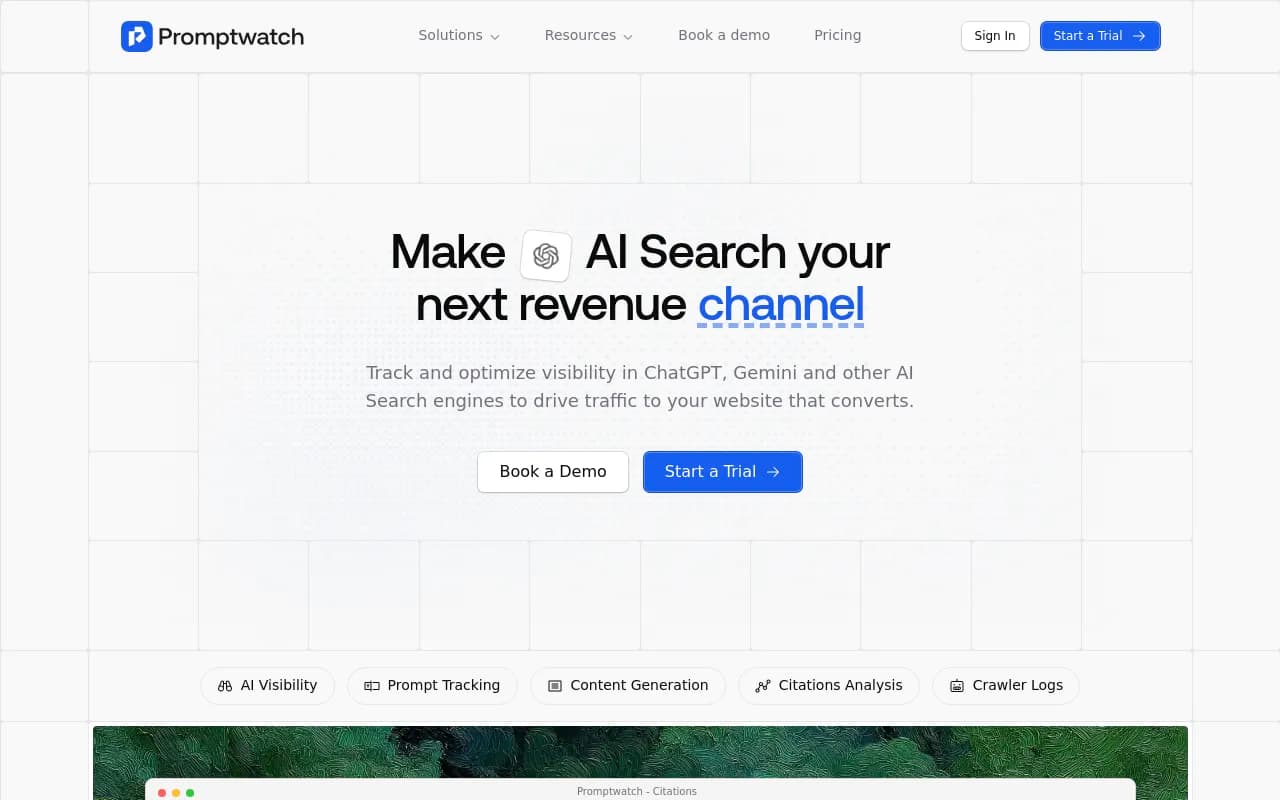
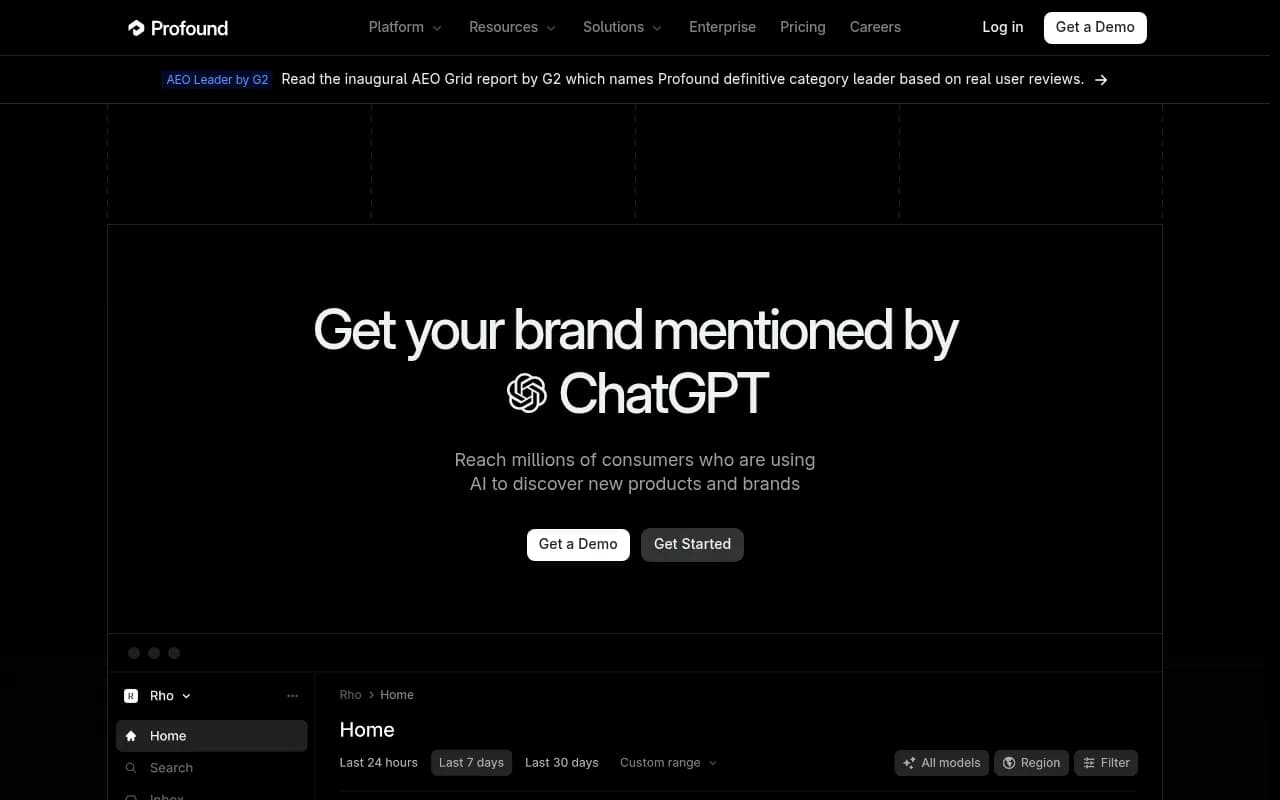
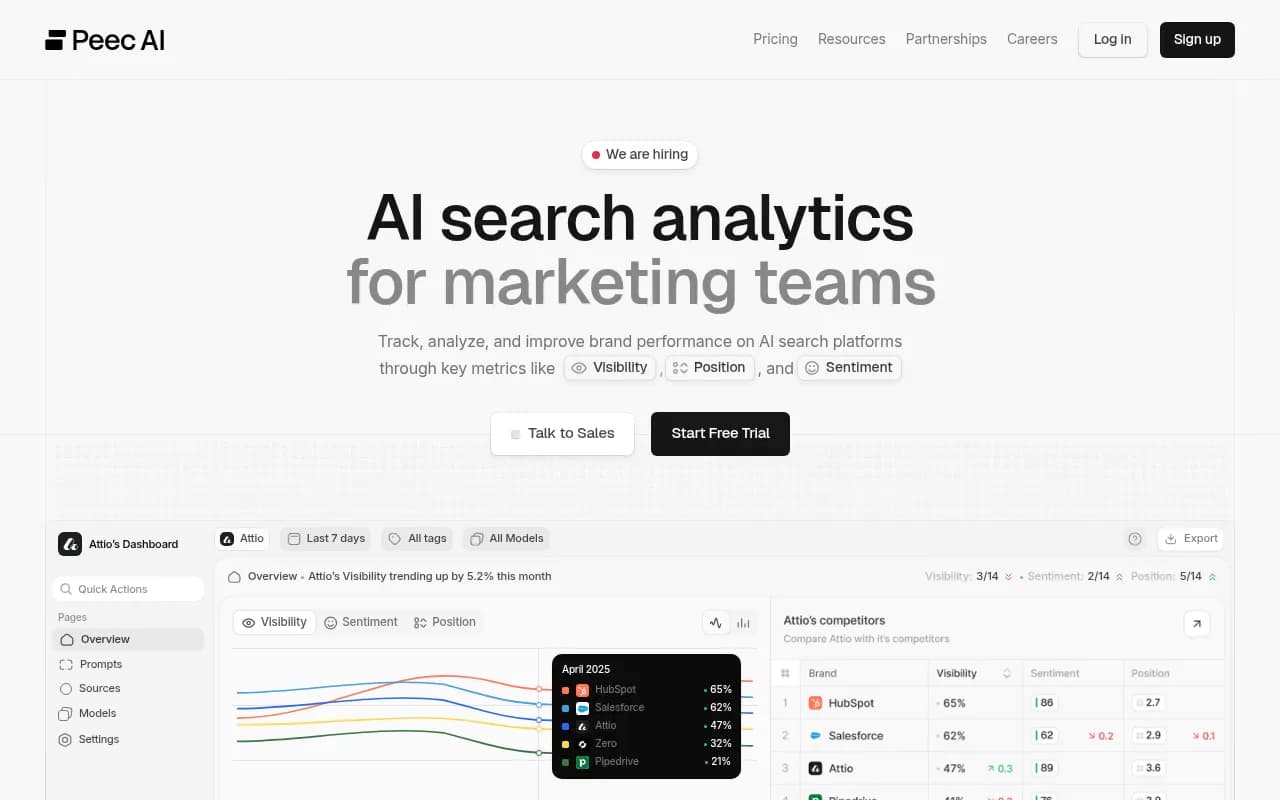
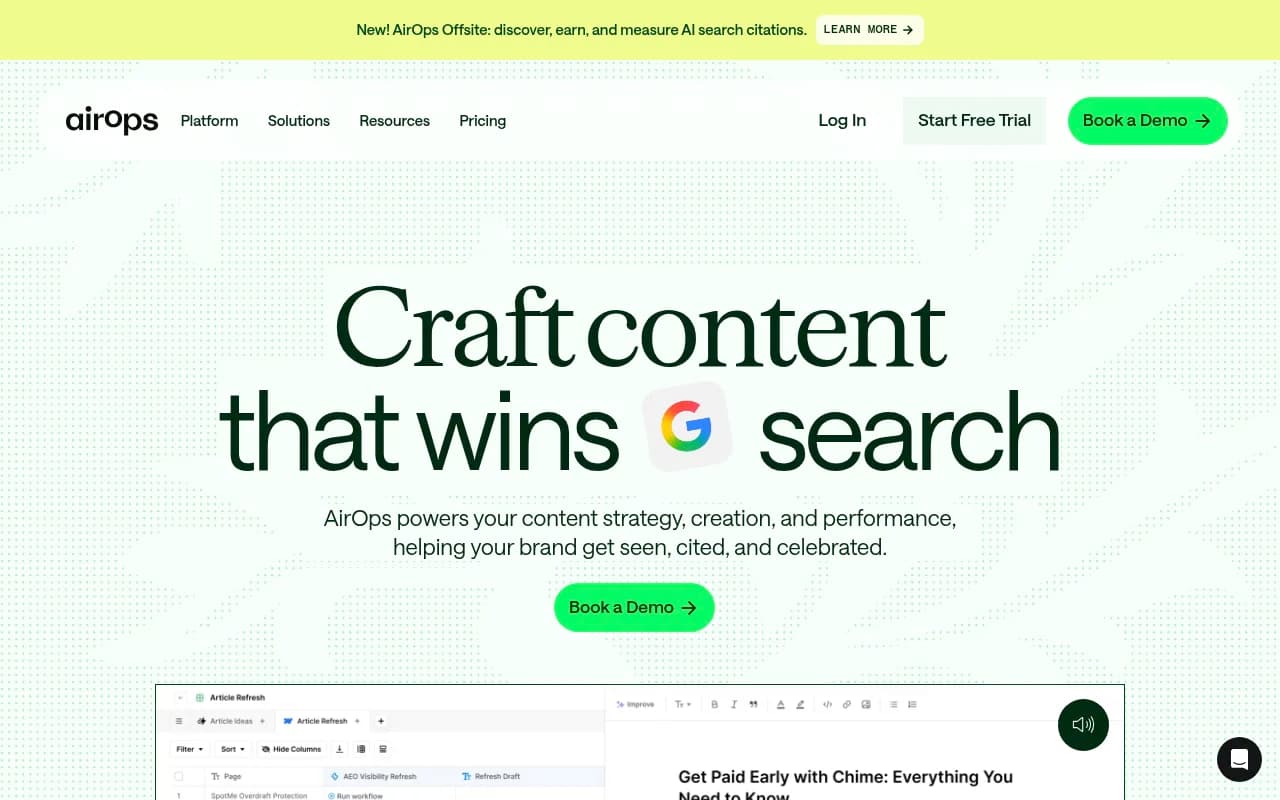
Other options in the same space include Profound for enterprise monitoring, Peec AI and Otterly.AI for lighter prompt tracking, and AirOps if you also want a content workflow tied to Search Console and GA4.
Profound
Otterly.AI

If you are comparing options, the GEO software directory at bestgeosoftware.com lists many more.
Layer 2: connect citations to traffic
Set up an AI referral segment in GA4
In Google Analytics 4, go to Reports > Acquisition > Traffic acquisition and filter the source for the main AI referrers: chatgpt.com, perplexity.ai, claude.ai, gemini.google.com and copilot.microsoft.com. Save it as a custom channel group called something like "AI search" so it shows up in every report without rebuilding the filter.
Then look at it per landing page. Which pages earn AI referral traffic? Those are the pages that are being cited and clicked, and they are the ones you should compare against your citation data.
Be honest about what GA4 misses
This is where many agency reports quietly mislead. Some AI visits arrive with no referrer and land in direct. Some assistants open links in apps that don't pass referrer data. So the GA4 number is a floor, not the real figure.
Say that to the client in the first report, in plain words. Something like: "The AI referral number is the minimum we can verify. We track citations separately to show influence that analytics can't see." Clients accept this far more readily when you raise it first than when they discover it later.
Use Search Console for the Google side
Google announced Generative AI performance reports in Search Console on June 3, 2026. They cover AI Overviews and AI Mode in Search, plus generative AI features in Discover, and report impressions, pages, countries, devices (Search only) and dates. Two caveats matter for client reporting. They are rolling out to only a subset of sites for now, so not every client will see them. And the announcement lists no clicks or conversion metrics, so this is evidence of exposure, not outcomes. Google's own announcement has the details.
Bing Webmaster Tools is worth adding, since Copilot draws on Bing and Microsoft has published its own research on AI-session conversions.
Add crawler evidence
One under-used proof point: server or CDN logs showing AI crawlers visiting the pages you changed. If you rewrote a page on the 3rd and GPTBot or OAI-SearchBot fetched it on the 5th, then it got cited on the 12th, you have a timeline a client can follow. Promptwatch's AI crawler data and its bots directory at promptwatch.com/bots are useful here, and its AI crawler traffic report covers weekly verified requests from OpenAI, Anthropic, Google, Perplexity and Mistral between June 8 and September 6, 2026.
Watch the volatility
Citations move. Promptwatch Data recorded reddit.com's share of ChatGPT citations falling from roughly 4% to 0.5% on August 14, 2026 (report), and ChatGPT started using the site: operator at scale on August 8, 2026, lifting such queries from about 0.4% to about 17% of fan-out queries (report). Neither was anything the client or you did. If your report shows a sudden dip, check whether the platform changed before you apologize.
Content type matters for durability too. In Promptwatch's half-life study of pages ChatGPT cited on July 6, 2026, landing pages and docs stayed cited longest while news lost half its pages within 36 days (report). If a client's wins are all news posts, warn them the gains will decay.
Social channels differ by engine as well. From Sep 28 to Oct 4, 2026, ChatGPT drew 0.46% of its citations from social platforms while Google AI Overviews drew 12.2% (report). A client who invested in YouTube or Facebook may see results in AI Overviews and almost nothing in ChatGPT. Report by engine.
Layer 3: connect traffic to conversions and revenue
Track conversions on the AI segment
In GA4, mark your key events (form submits, demo requests, purchases) as conversions and view them by the AI search channel group. Compare conversion rate and value per session against organic and paid. Report value per visit, not just sessions. A small AI number can outperform a large organic one, and Contently makes the same point.
Match to the CRM
For B2B clients, GA4 conversions are only the start. Add a hidden field to forms capturing the first-touch source and landing page, or pass the GA4 client ID into the CRM. Then you can say how many AI-sourced leads became opportunities and closed deals.
If the client has a complex journey, attribution platforms such as Dreamdata or Ruler Analytics can stitch sessions to revenue.
Add a "How did you hear about us?" free-text field too. Buyers who write "ChatGPT told me" give you evidence that no referrer will. It is crude, but clients love seeing real quotes.
Don't promise a multiplier
The published numbers are all over the place:
| Source | Claim | Caveat |
|---|---|---|
| Semrush | AI visitors convert about 2.3x organic | Vendor study |
| Microsoft Clarity | About 3x other channels | Different sample and definition |
| Opollo benchmark | 14.2% vs 2.8% (about 5x) | Benchmark report, methodology varies |
| Ahrefs via Averi | 0.5% of sessions, 12.1% of signups | One site's data, signups only |
These studies use different definitions and sample sizes. Quoting them is fine as context. Promising "5x conversion" to a client who has 40 AI sessions a month is a good way to lose them in month four. Use the client's own data, even when the sample is small, and state the sample size.
What the client scorecard should look like
Keep it to one page. A structure that works:
- Baseline vs now: citation rate and share of voice, split by commercial, informational and branded prompts.
- Trend line over 90 days, week by week.
- AI referral sessions, top landing pages, and conversions from that segment.
- Impressions from Search Console's generative AI reports, if available.
- Pipeline or revenue tied to AI-sourced leads, with the caveat on undercounting.
- Pages published or updated this month, with crawl date and first citation date.
- Next three actions.
Item six is the one that sells the work. It turns GEO from a vague idea into a log of cause and effect: we changed this page, the crawler came back, the page got cited, traffic arrived.
Cadence
Citation rate and AI referral traffic move quickly, so Contently suggests reporting them weekly. Conversion value takes longer to settle, so monthly is fine. I'd send a short weekly note internally and a full scorecard monthly to the client.
Tool options by reporting job
| Job | Option | Notes |
|---|---|---|
| Prompt tracking, crawler logs, AI traffic | Promptwatch | Ties citations to crawls and visits in one place |
| Enterprise monitoring | Profound | Higher price, monitoring focus |
| Lightweight tracking | Peec AI, Otterly.AI | Prompt tracking without much beyond it |
| Content plus measurement loop | AirOps | Connects to GSC and GA4 |
| Traffic analytics | Google Analytics | Free, needs AI channel group |
| Google exposure | Google Search Console | Generative AI reports for eligible sites |
| Revenue attribution | Dreamdata, Ruler Analytics, HubSpot | Matches visits to deals |
| Client dashboards | Whatagraph | Reporting for agencies |
One practical note on Promptwatch: it has a free tier, and paid plans start at $95/mo, with agency plans from $199/mo. Check promptwatch.com/pricing for current numbers before quoting a client.
A worked example
Say you run GEO for a B2B software client. In month one you freeze 80 prompts, 30 commercial, 30 informational and 20 branded. Baseline citation rates come back at 9%, 14% and 71%. You note that the client's pricing page is rarely fetched by AI crawlers and fix a robots and rendering issue. You rewrite three comparison pages and a docs page.
In month two, crawler logs show the new pages fetched within days. Commercial citation rate moves from 9% to 15%. GA4 shows AI referral sessions up from 60 to 95, with 4 demo requests instead of 1. Two of those four become opportunities in the CRM. Is that proof? It's a small sample, and you should say so. But the chain is complete: fix, crawl, citation, visit, lead, opportunity. By month four, with more data, the same chain is hard to argue with.
That's the pattern. You don't need big numbers in month one. You need a clean, honest chain you can extend.
Common mistakes
- Showing screenshots as proof. One answer is an anecdote.
- Changing prompts between reports.
- Blending branded and non-branded prompts, which makes everything look better than it is.
- Quoting industry conversion multipliers as client forecasts.
- Ignoring platform shifts and blaming or crediting yourself for them.
- Reporting only what went up. Clients trust you more when you show the page that lost citations and what you're doing about it.
Who should do this reporting
If you have a team that can handle it, build it in-house. If you'd rather hand it to specialists, an agency like 1001 SEO Media combines technical SEO, content and AI search work with transparent monthly reporting, and uses Promptwatch for AI visibility measurement.
Whatever you choose, the order is the same: freeze the prompts, baseline the visibility, set up the AI segment, match to revenue, and report the chain with its caveats. For more first-party data on how AI engines pick sources, browse Promptwatch Data.
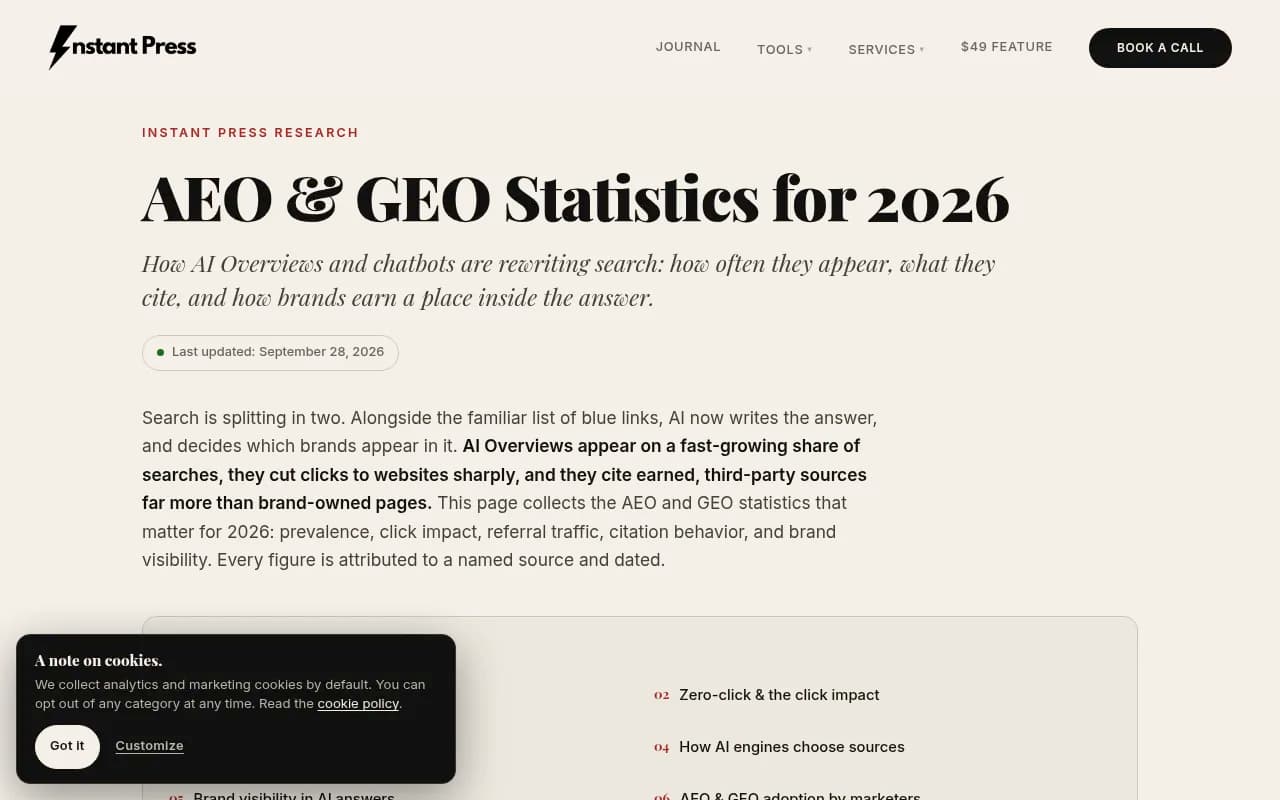
The screenshot above shows the kind of third-party statistics clients often quote back at you. Be ready to explain which are vendor studies and which are your own measured data.